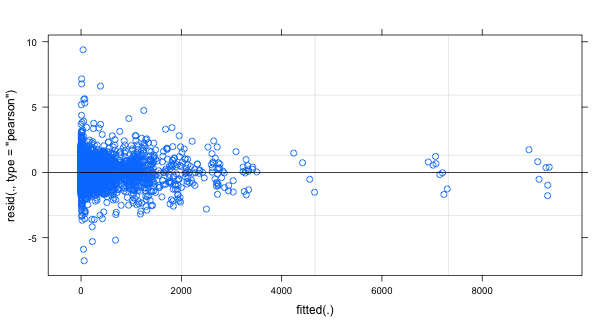
I ran a model and got the following residuals:

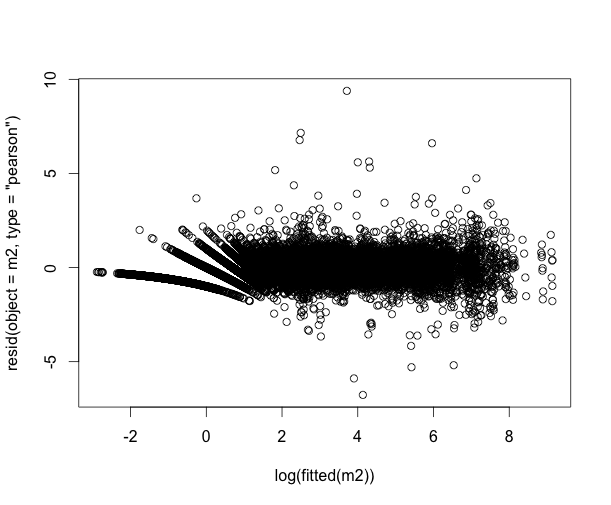
I proceeded to log the fitted values to get an idea of what's happening at the lower end of my predicted values:

It was then I saw on the left side the banded values. Their formation in stripes made me wonder what phenomenon could be producing this? Should I be adjusting my model somehow or just chalk this up to a quirk when logging fitted values?
These are from a negative binomial mixed effect model in R, if that helps.
