3
$\begingroup$

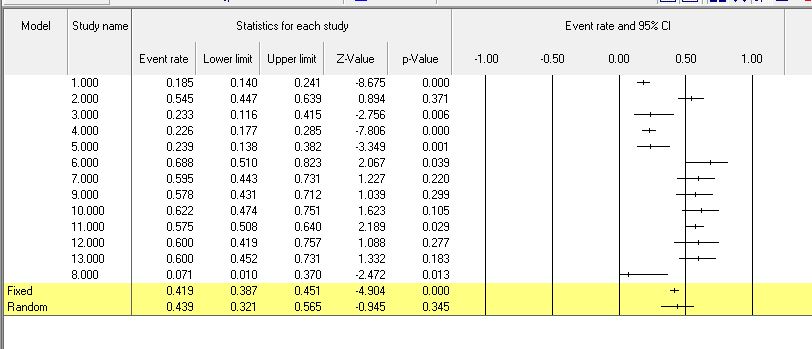
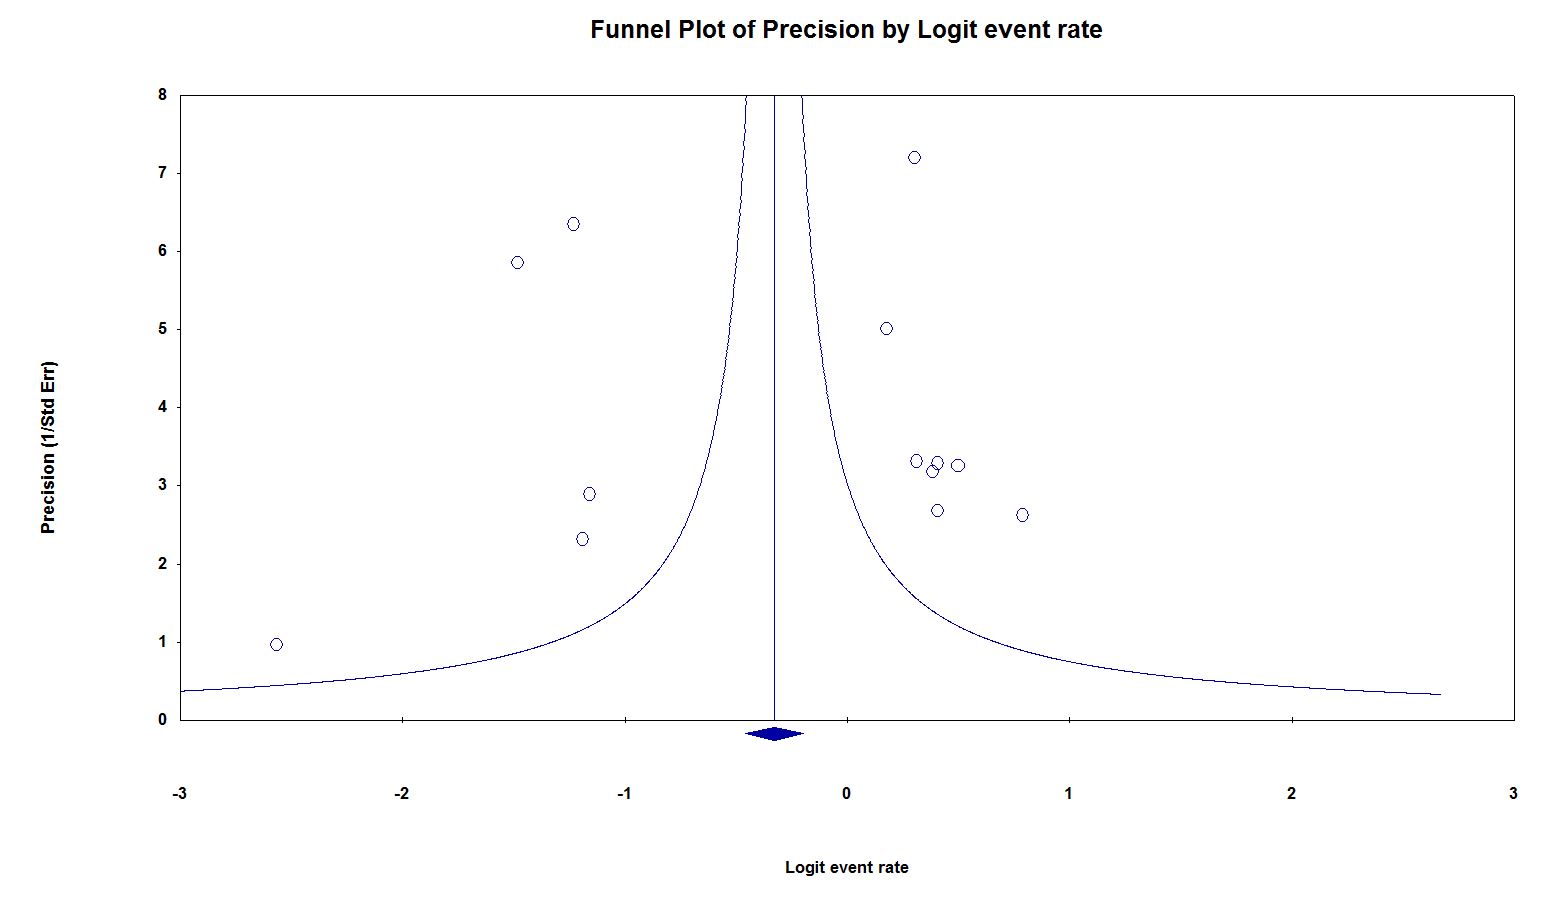
Hopefully someone can assist a bit, I just came across a funnel plot that I can not interpret. I have a feeling it is due to the high heterogeneity in the Meta-analysis. (I2= 92%)

Basically, this was a systematic review assessing the incidence of h pylori infections in patients with a specific symptom. All papers werr included, rct, cohorts, case series. The primary endpoint was incidence of the infection in this population. There werr 14 studies in total included. We then did a one way meta anaysis (which u see) using random effects model to get an estimate and 95%ci of the incidence. Some patients had reflux. Disease and some didn't, so i wonder is it possible that the clustering is due to "groups" of studies. Please let me know what additional info would help. Therr is also different methods of. Diagnosis used in each study, different countries which would affect rates of infection. All increasing heterogeneity.

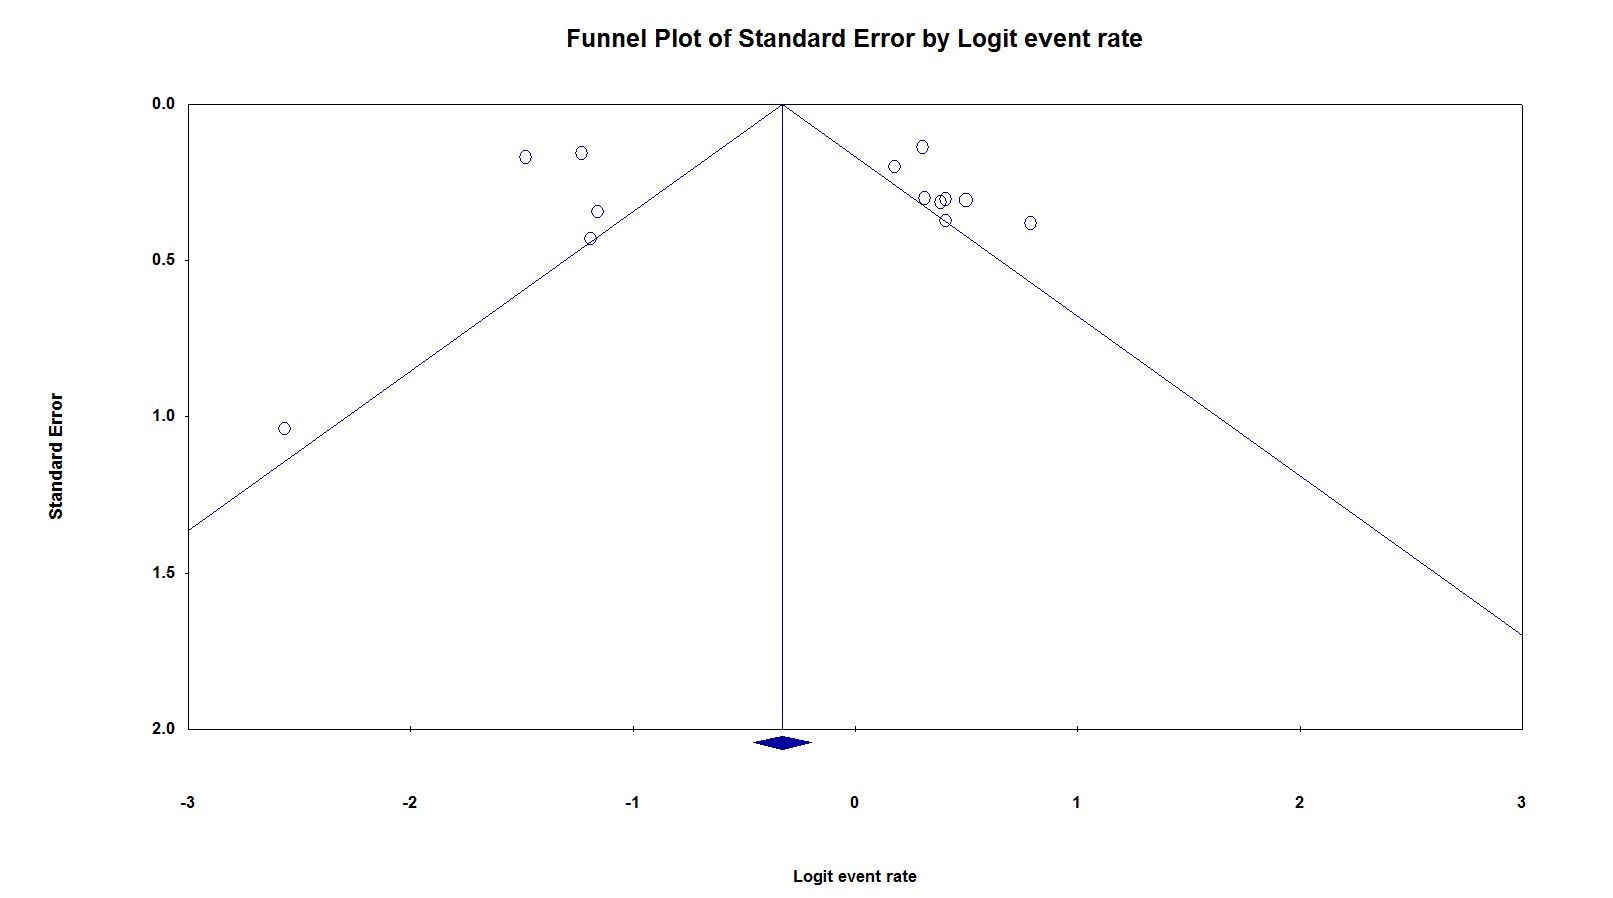
enter image description here enter image description here enter image description here enter image description here Any thoughts would be appreciated.

$\endgroup$

3 Answers 3

1
$\begingroup$

Funnel plots are sometimes difficult to interpret and asymmetrical plots can be due to factors other than the presence of publication bias. In this case, and as mentioned, there seems to be clustering of data points leading to marked heterogeneity. The answer to your question is that there is no 'evidence' of publication bias, but I question (based on the available information) if pooling data from these studies is appropriate.

$\endgroup$
2
  • $\begingroup$ I would agree with you, but pooling these studies with a moderator might be fine, don't you think? $\endgroup$
    – Emilie
    Commented Jan 21, 2016 at 13:46
  • 1
    $\begingroup$ I need more information to understand what was done, and the reasons why it was done, before I can properly respond. $\endgroup$
    – abousetta
    Commented Jan 21, 2016 at 17:08
1
$\begingroup$

I agree with @abousetta that we need more detail about the studies. On the face of it they fall into two distinct groups. Do you have more information about them which might help to enlighten us (and you)?

$\endgroup$
1
  • $\begingroup$ When you say some patients had reflux do you mean that some studies had patinets with reflux and some did not? If you do then does that correspond to the grouping which your funnel plot shows? I think what I and other commentators have been concerned about is that the assumption of random effects m-a that the true effects are drawn from a single distribution seems to be violated here and in fact you have a mixture distribution. $\endgroup$
    – mdewey
    Commented Jan 25, 2016 at 16:41
0
$\begingroup$

Basically, this was a systematic review assessing the incidence of h pylori infections in patients with a specific symptom. All papers werr included, rct, cohorts, case series. The primary endpoint was incidence of the infection in this population. There werr 14 studies in total included. We then did a one way meta anaysis (which u see) using random effects model to get an estimate and 95%ci of the incidence. Some patients had reflux. Disease and some didn't, so i wonder is it possible that the clustering is due to "groups" of studies. Please let me know what additional info would help. Therr is also different methods of. Diagnosis used in each study, different countries which would affect rates of infection. All increasing heterogeneity.
$\endgroup$
1
  • $\begingroup$ Did you intend to add this to your original question? If so, you can edit your question with the "edit" button right above where it shows your user name and picture $\endgroup$ Commented Jan 22, 2016 at 13:10

Your Answer

By clicking “Post Your Answer”, you agree to our terms of service and acknowledge you have read our privacy policy.

Not the answer you're looking for? Browse other questions tagged or ask your own question.