4
$\begingroup$

EDIT: Background: I need to (lin) scale a big dataset to e.g [0,10]. Outliers (in example below 1 and 10000 get (non lin) mapped to resp 0 and 10, the rest (50,51 in this case) is scaled over 0 to 10 The goal is to catch as much as numbers in this range. If I do not protect myself against very large/small outliers all other values will be mapped to a very small range if that happens.

Assume I have a big dataset (million numbers), and I want the smallest range without outliers.

So e.g. I have:

$$x=[1,1,50,50,50,50,50,50,50,50,51,51,51,51,10000,10000]$$

I am looking for "the smallest range which include the maximum number of numbers", so that I am looking for an algorithm which finds $50$ (lower bound) and $51$ (upper bound) in this case.

My question:

  • What is the statistical term or name of this kind of questions?
  • How can I solve this?
  • (For academics) are there any papers/researchers who wrote about different possibilities about solving this.

My ideas:

So my initial idea was: range = [average/mean $\pm$ $1$ or $2$ standard deviations)

$$\matrix{\text{mean}(x) &=& 1287\\ \text{std}(x) &=& 3292\\ \text{mean}(x) - \text{std}(x) &=& -2005}$$

So that is not a solution, so second thought:

$$\text{median}(x) - \text{std}(x) = -3242$$

So that also does not help.

$\endgroup$
7
  • $\begingroup$ Have you tried $\mathrm{median}(x)\pm2\mathrm{MAD}(x)$? Search for "robust statistics" to see if that helps. $\endgroup$
    – Francis
    Commented Jan 27, 2016 at 2:38
  • 1
    $\begingroup$ "I want the smallest range without outliers" - what is your definition of an outlier? $\endgroup$
    – Glen_b
    Commented Jan 27, 2016 at 7:23
  • 1
    $\begingroup$ Apart from needing a definition of outlier, the formulation is contradictory. In your example, and generally, smallest range and largest number push your interval in and out and you need a criterion for compromise. There has been some attention to finding the shortest half (and by implication if not extension the shortest interval containing any specified fraction). It's not become a routine procedure anywhere that I know. $\endgroup$
    – Nick Cox
    Commented Jan 27, 2016 at 9:32
  • $\begingroup$ In general, never use the SD in any criterion to identify outliers, as it's affected by anything that might possibly be an outlier. $\endgroup$
    – Nick Cox
    Commented Jan 27, 2016 at 9:35
  • $\begingroup$ @NickCox since there are some discussion points which would fit this question but not that one, I don't think that's an exact duplicate, but it's definitely very closely related (and the question there is more clearly framed). $\endgroup$
    – Silverfish
    Commented Jan 27, 2016 at 10:32

2 Answers 2

2
$\begingroup$

There is no universal solution to your problem and there really cannot be without specific knowledge of the population. It the value is ridiculous for the population, leave it out. But you should have done this before you tried to analyze with it (easy for me to say).

You can consider Grubbs' Test and its variants.

MAD always sounds good but whenever I've used it, it performs poorly, at best.

In a particular analysis, leverage analysis and various leave-out algorithms evaluate the impact of the point...did it really impact the analysis.

Nonparametric (distribution-free) analysis is a better idea.

In many cases, a log-transform will make outliers go poof.

In many cases, removing one outlier will expose another...and so on...until it is difficult to argue that you are not pruning your data like a topiary -- "What a gorgeous elephant!".

$\endgroup$
0
$\begingroup$

You could divide the data into equal bins to find the bin size (and offset) that yields a suitable maximum bin count. Here is an example using the following data.

a = {463, 463, 512, 512, 512, 512, 512, 512, 512,
     512, 513, 513, 513, 513, 10462, 10462, 880, 880,
     929, 929, 929, 929, 929, 929, 929, 929, 930, 930,
     930, 930, 10879, 10879, 181, 181, 230, 230, 230, 
     230, 230, 230, 230, 230, 231, 231, 231, 231, 10180,
     10180, 416, 416, 465, 465, 465, 465, 465, 465, 465,
     465, 466, 466, 466, 466, 10415, 10415};

maxA = 10879;

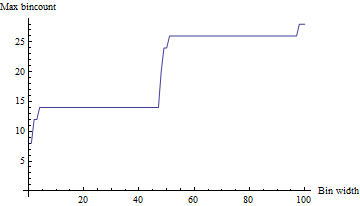
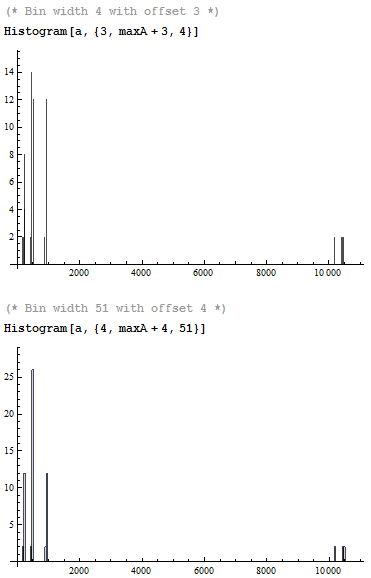
Increasing the bin count from 1 to 100 (offsetting the bin start to capture all variations) produces the following plot of maximum bin count. For example, a bin width of 4 with an offset of 3 captures a maximum bin count of 14, and a bin width of 51 with an offset of 4 captures a maximum bin count of 26.

Selecting from a where (4 + 51 * 9) <= a < (4 + 51 * 10) finds 26 items. The rest are outliers. How narrow you want the bins is a subjective choice.

enter image description here

enter image description here

Mathematica code for the above

largestBinWidth = 100;

counts = Table[
   Table[
    {binsize, offset, 
     Max[BinCounts[a, {offset, maxA + offset, binsize}]]},
    {offset, -binsize, binsize}],
   {binsize, 1, largestBinWidth}];

maxcounts = Last[SortBy[#, Last]] & /@ counts;

ListLinePlot[maxcounts[[All, {1, 3}]],
 PlotRange -> All, AxesOrigin -> {0, 0},
 AxesLabel -> {"Bin width", "Max bincount"}]
$\endgroup$
1
  • 1
    $\begingroup$ The more general idea here in classic terms is just to find the (main) mode. As this answer underlines, finding the bin with highest frequency requires consideration of variable bin width and origin. But there are algorithms for finding the mode that don't depend on binning. See e.g. stats.stackexchange.com/questions/176112/… $\endgroup$
    – Nick Cox
    Commented Jan 27, 2016 at 11:18

Not the answer you're looking for? Browse other questions tagged or ask your own question.