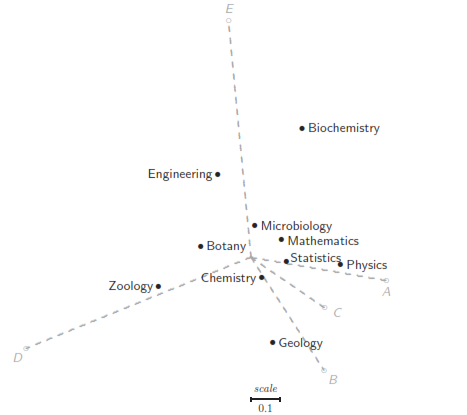
I am reading the book by correspondence analysis in practice by Michael Greenacre.It has the following example.

How do we find what row profiles are associated with column profiles.
In the book it says 
I do not understand what this means and how the row column association is found.So does this mean I have to project the row profiles into each of the column profiles (which are the vertices of the map) and then if this projection value is large then that particular row profile is associated with that column profile. Is it how the interpretation done?
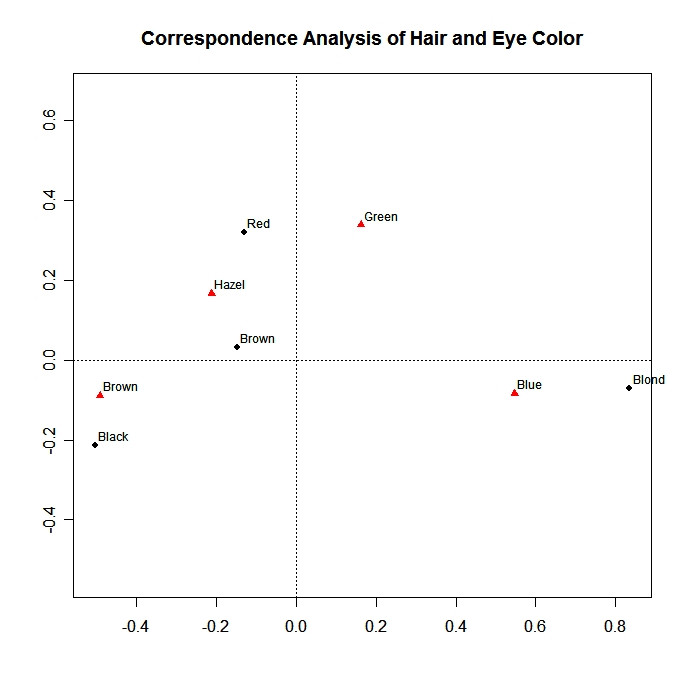
But can't we just look at the bi plot and say if a particular row profile and column profile are displayed close together they are associated? As in this bi plot  where the red triangles represent eye colour and the black dots represent hair colour, can't I say brown eyes and black hair color are associated as they are closely mapped and so is blue eyes and blond hair.
or do i have to make row profiles projected on to column profiles. In that case how to calculate these projection values?
if someone can guide me as to determine which row profiles are associated with column profiles I would be grateful.

take a fixed reference direction and then line up the projections of all rows on this axis.... $\endgroup$