0
$\begingroup$

I ran multiple regression with three predictor variables, which according to the theory I am using, should all predict the dependent variable.

However, one of the variable's partial plot shows what looks like a zero slope. The standardised coefficient is -.032 for this variable.

Below is the partial plot. Does it make sense to include this in the regression model? I was initially not going to include it on the grounds that it violates the assumption of linearity, but then I realised that there is some form of linear relationship, albeit a zero/horizontal slope.

This is m first project I have had to use statistics for, and I have no teaching in it at all, so have had to self-study so excuse any naivety.
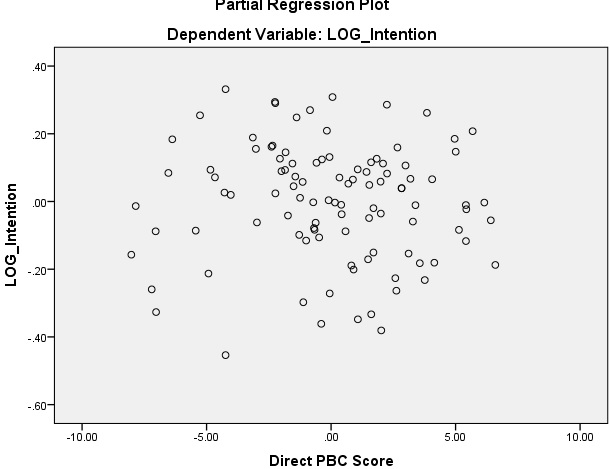
enter image description here I would really appreciate your help so if you read this and can help please please do so :)

$\endgroup$

1 Answer 1

1
$\begingroup$

First off, the assumption of linearity applies only to the parameters $\beta$, $x_i$ can be squared, loged or whatever you would like. You assume only that $y$ can be written as linear combination of $x_i$. Try using something more flexible, and see where that takes you.

Now for the half of the question, the problem is not if -.032 is numerically close to 0 or not. But rather if there is a significant effect, depending on how the variables are measured it might actually be a big number -- you need to interpret the impact and argue why it does or does not make sense (or if the effect if even worth considering). The p-value can help guide you, but do not abuse it i.e. a p-lavue < 0.05 does not automatically imply importance or relevance.

If the variable is correlated with the independt variables in the model, you might wish to keep it regardless of its effect on the outcome - since leaving it out can cause bias and inconsistency in the remaining estimates.

$\endgroup$
4
  • $\begingroup$ Thank-you Repmat, thank makes sense. I did try many transformations with the DV but it didn't help - Log, inverse, square, square root, etc. My IV has already undergone a logarithmic transformation. Your point about the coefficient itself not being the issue, but rather its significance - brilliant! And in this case p=.678 anyway. I will keep it in due to some correlation with the other IVs according the the pearson's correlation results. I want to put what you say about not removing the IV so I don't cause bias and inconsistency in my report, do you know what reference I can use? $\endgroup$
    – QT93
    Commented Apr 3, 2016 at 8:40
  • $\begingroup$ Any book that gives an introduction to regression analysis, should contain a discussion on bias - so almost any book will do. Wooldridge: Econometric Analysis of Cross Section and Panel Data, 2nd Edition or Introductory Econometrics: A Modern Approach, 4th Edition are two prime examples $\endgroup$
    – Repmat
    Commented Apr 3, 2016 at 17:02
  • $\begingroup$ How do I do that? $\endgroup$
    – QT93
    Commented Apr 22, 2016 at 15:10
  • $\begingroup$ @QT93 there is a button you can press to the left of my question at the top. $\endgroup$
    – Repmat
    Commented Apr 22, 2016 at 15:14

Your Answer

By clicking “Post Your Answer”, you agree to our terms of service and acknowledge you have read our privacy policy.

Not the answer you're looking for? Browse other questions tagged or ask your own question.