Most of the issues in the original question and its trail of comments arise from only having 3 animals in the data set. When I was doing animal experiments, long ago, there was a rule-of-thumb that you should have at least 6 animals per group. It thus may be hard in any event to get results published based on 3 cases. Nevertheless, let's see what can be done with this limited data set.
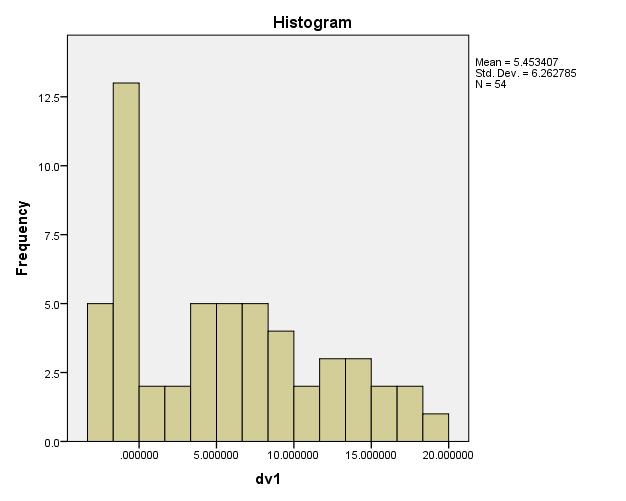
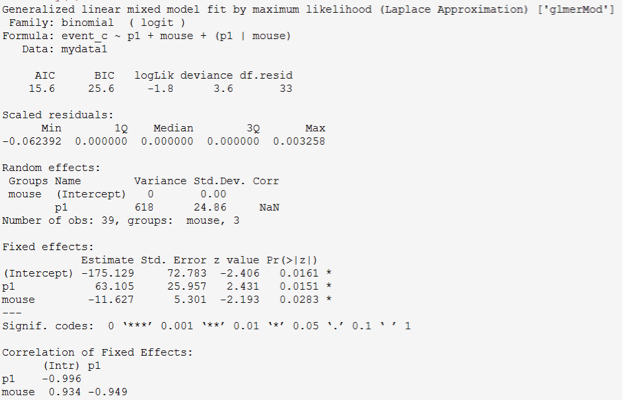
As I understand the setup, there is an experimentally applied "escalating dose of a specific parameter," which alters the "activating function" ("a measure of the influence of an extracellular field on axons/neurons"), which in turn is thought to influence the probability of occurrence of some event. The displayed histogram is for the "activating function" values. There is a total of 39 observations of (event/no-event) among 3 animals, according to the output from the logistic regression attempt, although there seem to be a few more observations of the activating function in the histogram.
The "activating function" in this case would be a "dependent variable" from the perspective of the applied parameter, but under the logic of the previous paragraph the "activating function" would be considered a predictor variable for the event. To analyze the data this way you would have to know (or demonstrate) that the applied parameter only influenced the event probability through its influence on the "activating function." We'll put that aside for now.
For predicting event occurrence, the rule of thumb is that you need about 15 of the least-frequent of (event/no-event) per predictor variable examined in a logistic regression model. With 39 observations, that number can be no more than 19. That only leaves room for 1 predictor variable without danger of over-fitting. So one possibility would be logistic regression of event against the "activating function" (called "p1" in the displayed regression output). The significance of the regression slope coefficient for p1 in the logistic regression could be evaluated, although with so few total observations the estimate of the intercept will tend to be imprecise.
With more events among the 3 mice, or a larger number of mice, it might be possible to include a correction for mouse-to-mouse differences. The original idea in the question was to treat mice as a random effect (1|mouse). This has the advantage of only counting as 1 extra predictor in the model, but doesn't always work well with so few mice. Treating the 3 mice as fixed effects would be equivalent to adding 2 predictors to the model, which is more than the present data set might be able to handle reliably. Including interactions or random effects for both the intercept and regression slopes would require even more cases.
Another way to proceed would be to compare the activating-function values associated with the events versus the no-events in a linear model. That is effectively treating the activating function values as a "dependent" variable, with the event/no-event as the "independent" variable, even though the logical/causal direction is opposite. There's nothing wrong with that. If significant differences were found, one could say "The occurrence of an event was associated with a higher activating-function value..." With 39 observations you could handle 2 or maybe even 3 predictors in such a linear model.
This brings us back pretty much to the original idea in the question: treat the "activating function" as a dependent variable, with mice perhaps considered as a random effect or fixed effects. This data sample probably would allow for evaluating that number of predictors, although the small number of animals would make one worry abut its applicability to other sets of the same mice, other strains of mice, other related but not identical experimental conditions, and so forth.
This analysis would not require a normal distribution of the observations. For properly interpreting p-values and the like what you need is normal distributions of the residual errors around the fitted values for the groups analyzed. Unfortunately, the way some introductory statistics course are taught can lead to a misplaced emphasis on normal distributions of the data themselves. Non-parametric tests could also be considered if residuals are non-normal.
Finally, back to the logic of the experimental setup. If you are manipulating some "parameter" that affects the "activating function" and then the probability of the event changes, you really need to make sure that the "activating function" value is not just an epiphenomenon that happens to change along with a direct effect of the "parameter" on the "event" probability. Yes, you can always make the association between the "activating function" and the event, by logistic regression or a linear model, but the causal interpretation requires a good deal of backup in this type of experimental design.


