6
$\begingroup$

I'm using PyMC3 in Python 3 and I'm not sure exactly how to optimize my starting parameters. The example uses the regression dataset that comes with scikit-learn; the diabetes data has the fewest attributes. By just looking at the data (i.e. the [samples x attributes] matrix and the target vector) how can I know what parameters to use for my mu and std in my Normal distribution for my beta coefficients?

Both these models can predict, I can calculate the difference between predicted value and actual value (e.g. root mean squared, absolute error, etc) but is there a way in Bayesian to optimize the parameter defaults for the prior? I can't use sklearn.grid_search.GridSearchCV. There are literally an infinite number of possibilities for me to choose for the mu and std so I don't know how I could know which parameters to start with for my priors.

Would it be useful to use the distribution of the target vector and work backwards from there to reveal information about the prior distribution?

The modules I used:

import pymc3 as pm
import numpy as np
import pandas as pd
import matplotlib.pyplot as plt
import theano as th
import seaborn as sns; sns.set()
from scipy import stats, optimize
from sklearn.datasets import load_diabetes
from sklearn.cross_validation import train_test_split
from collections import *
np.random.seed(9)

%matplotlib inline

Here is how to load and get stats on the data:

#Load the Data
diabetes_data = load_diabetes()
X, y_ = diabetes_data.data, diabetes_data.target

#Assign Labels
sample_labels = ["patient_%d" % i for i in range(X.shape[0])]
attribute_labels = ["att_%d" % j for j in range(X.shape[1])]

#Create Data Objects
DF_X = pd.DataFrame(X, index=sample_labels, columns=attribute_labels)
SR_y = pd.Series(y_, index=sample_labels, name="Targets") 

#Split Data (_tr denotes training set, _te is test set)
DF_X_tr, DF_X_te, SR_y_tr, SR_y_te = train_test_split(DF_X,SR_y,test_size=0.25, random_state=0)

#Convert to array for faster indexing
X_tr, X_te, y_tr, y_te = DF_X_tr.as_matrix(), DF_X_te.as_matrix(), SR_y_tr.as_matrix(), SR_y_te.as_matrix()

#Describe Attributes
DF_describe = DF_X_tr.describe()
DF_describe

enter image description here

Here's how I created my regression model:

#Preprocess data for Modeling
shA_X = th.shared(X_tr) #I use `shared` for predicion later . http://pymc-devs.github.io/pymc3/notebooks/posterior_predictive.html?highlight=sample_ppc

#Generate Model
linear_model = pm.Model()
with linear_model: 
    # Priors for unknown model parameters    
    alpha = pm.Normal("alpha", mu=y_tr.mean(),sd=10)
    betas = pm.Normal("betas", mu=0,
                               sd=10, #I use 10000 for this one in the left panel
                               shape=X.shape[1])
    sigma = pm.HalfNormal("sigma", sd=10)

    # Expected value of outcome
    mu = alpha + pm.dot(betas, shA_X.T) #mu = alpha + np.array([betas[j]*shA_X[:,j] for j in range(X.shape[1])]).sum(axis=0)

    # Likelihood (sampling distribution of observations)
    likelihood = pm.Normal("likelihood", mu=mu, sd=sigma, observed=y_tr)

    # Obtain starting values via Maximum A Posteriori Estimate
    map_estimate = pm.find_MAP(model=linear_model, fmin=optimize.fmin_powell)

    # Instantiate Sampler
    step = pm.NUTS(scaling=map_estimate)

    # Burn-in
    trace = pm.sample(10000, step, start=map_estimate, progressbar=True, njobs=1)

#Traceplot
pm.traceplot(trace, lines={k: v['mean'] for k, v in pm.df_summary(trace).iterrows()})

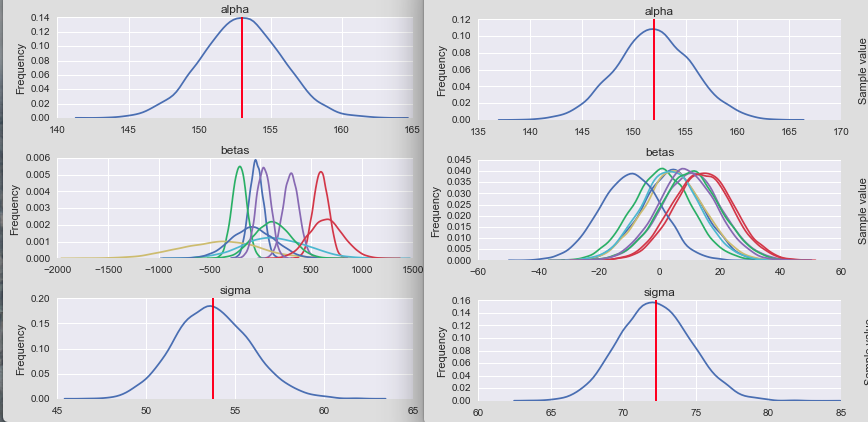
There one on the left is with a larger std for the betas. How can I know what to set for my default parameters by just looking at the data?

enter image description here

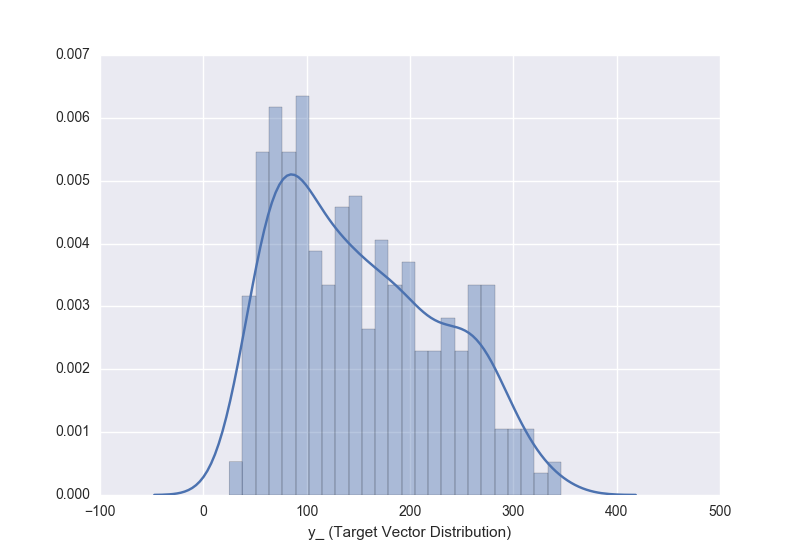
This is what my target vector of the entire dataset looks like should I use this to give me a hint at what to use for my prior distributions?:

sns.distplot(y_, bins=25)

enter image description here

$\endgroup$
4
  • 1
    $\begingroup$ The Bayesian way to go would be to use hyperpriors, i.e. use priors for your priors. $\endgroup$
    – Tim
    Commented May 27, 2016 at 9:04
  • $\begingroup$ Hey, thanks for the suggestion! I'm still not sure what starting parameter to use for the hyperprior based on the data...or even which distribution to use for the hyperprior. I feel like there must be SOME way to make some inferences based on the stats in my DF_describe dataframe that describes the data. $\endgroup$
    – O.rka
    Commented May 27, 2016 at 14:39
  • 1
    $\begingroup$ You choose priors prior to seeing the data, not based on it. If you set up priors based on the data you have then you use the same data twice: to set prior and then to calculate likelihood, so to multiply the two in the end to get posterior. Maybe you should start with some Bayesian habdbook like "Bayesian data analysis" by Gelman et al or "Doing Bayesian Data Analysis" by Kruschke ? $\endgroup$
    – Tim
    Commented May 27, 2016 at 14:42
  • $\begingroup$ That makes sense but certain parameters for the prior and certain distributions would work better than others. If I used a mu ~ normal, I would get a different result than a mu ~ normal. How could you know which ones to use based on the architecture of the data? Would you look at the distribution of the target vector and then work backwards from that? Even tho the prior is chosen before seeing the data, could it be "optimized" if you took some knowledge of what the data actually looks like? I understand posterior probabilities but the confusing part is where to start for defaults. $\endgroup$
    – O.rka
    Commented May 27, 2016 at 14:59

2 Answers 2

5
$\begingroup$

I'll illustrate my answer with a simple example. Imagine that your data $X_1,\dots,X_n$ are counts that follow a Poisson distribution. Poisson distributtion is described using a single parameter $\lambda$ that we want to estimate given the data we have. To set up a Bayesian model we use Bayes theorem

$$ \underbrace{p(\lambda| X)}_{\text{posterior}} \propto \underbrace{p(X | \lambda)}_{\text{likelihood}} \underbrace{p(\lambda)}_{\text{prior}} $$

where we define likelihood function as a Poisson distributtion parametrized by $\lambda$ and we use as a prior another Poisson distributtion parametrized using hyperparameter $\theta$:

$$X_i \sim \mathrm{Poisson}(\lambda) \\ \lambda \sim \mathrm{Poisson}(\theta) $$

Your question is basically about how to find "optimal" $\theta$. Recall that Poisson's distributions parameter is also it's mean. It's maximum likelihood estimator is sample mean, so the "optimal" value for $\theta$ after looking at the data would be to use sample mean. If you did so, than what you would be calculating is given that prior mean is $\theta$ find the optimal value of $\lambda$ such that it maximizes the likelihood -- can you see the circularity? $\theta$ is already an optimal value given the data we have and then we use it to find the optimal value... In such case wouldn't maximum likelihood estimation be more honest way to go?

To learn more about choosing priors check How to choose prior in Bayesian parameter estimation that goes into more details about choosing informative priors, i.e. priors based on some knowledge that we had before seeing the data. If we don't have such information, we use weekly informative priors that say very little about what we assume about the parameter of interest (e.g. uniform distribution over some reasonable range). Finally, if you have no ideas about the parameters of your priors you can use hyper-priors, i.e. priors for parameters of priors, and then the Bayesian machinery will find the "optimal" parameters for priors for you (but yes, you need to decide about the values of hyperpriors and this is not always that obvious).

Finally, there is an approach called empirical Bayesian method, but as you can see from the example, the risk in here is that we can end up with estimates that are overconfident since we used the same data twice.

Check "Bayesian Data Analysis" by Andrew Gelman, John Carlin, Hal Stern, David Dunson, Aki Vehtari, and Donald Rubin for great introduction and multiple examples about choosing priors. "Doing Bayesian Data Analysis" by John K. Kruschke provides nice introduction about hierarchical models and hyperpriors. Finally, "Data Analysis: A Bayesian Tutorial" by Devinderjit Sivia and John Skilling give some discussion about "using the same data twice".

$\endgroup$
2
$\begingroup$

Intuitively, the one on the left seems to give you unreasonably large coefficients.

To be more quantitative, you can do model comparison. Cross-validation is one way to compare them, but there exist various other measures that estimate the result you would get in a cross-validation. PyMC3 has various model comparison measures, including DIC, WAIC and LOO: http://pymc-devs.github.io/pymc3/api.html#pymc3.stats.loo

$\endgroup$
1
  • 1
    $\begingroup$ How do those work when they only take in the trace and the model? Is the vector of targets (i.e. y_tr) embedded in the model object? $\endgroup$
    – O.rka
    Commented May 27, 2016 at 14:09

Your Answer

By clicking “Post Your Answer”, you agree to our terms of service and acknowledge you have read our privacy policy.

Not the answer you're looking for? Browse other questions tagged or ask your own question.