2
$\begingroup$

Usually I know how to do these problems, but this one stumped me. This is what the problem says:

"Let $D$ denote the event that a person selected randomly from a population has a disease, and suppose $P(D) = 0.0002$.

Let $T$ denote the event that the screening test is positive for a person selected at random.

Suppose the manufacturer claims that the rate of false positives is $0.02$ and the rate of false negatives is $0.01$.

Compute $P(T)$."

So $P(D^c \mid T) = 0.02 \implies P(D \mid T) = 0.98$

And $P(D \mid T^c) = 0.01 \implies P(D^c \mid T^c) = 0.99$

$P(T) = P(T \mid D)P(D) + P(T \mid D^c)P(D^c)$, but I don't know how to find $P(T \mid D)$ or $P(T \mid D^c)$.

$P(T \mid D) = \frac{P(D \mid T)P(T)}{P(D)}$, but this equation has two unknowns.

Any help would be much appreciated.

$\endgroup$
4
  • 2
    $\begingroup$ Totally different hint: ignore the algebraic notation. Consider a population of a million people. Use the information to count the people with and without the disease. Imagine giving them all the test. For each group, count how many people have a positive result. Your answer will be the sum of these counts divided by the original million people. $\endgroup$
    – whuber
    Commented May 31, 2016 at 21:24
  • $\begingroup$ I would suggest you to add the self-study tag to this question as there is no way to distinguish it from an assignment. $\endgroup$
    – Xi'an
    Commented Jun 1, 2016 at 6:29
  • $\begingroup$ @MatthewGunn Sorry, I'm still stuck. $P(D) = P(D \mid T)P(T) + P(D \mid T^c)P(T^c) \implies .0002 = .98P(T) + .01P(T^c) = .98P(T) + .01(1 - P(T)) = .97P(T) + .01 = .0002$ Solving for $P(T)$ gives you a negative value. $\endgroup$
    – Joe
    Commented Jun 6, 2016 at 19:24
  • $\begingroup$ @Joe The problem is that the false positive rate is $P(T|D^c)$ not $P(D^c|T)$. See an update to my answer for the algebra. $\endgroup$ Commented Jun 6, 2016 at 21:12

2 Answers 2

3
$\begingroup$

Along @whuber's suggestion lines, you can create a two by two matrix with either probabilities: $$\begin{array}{c|cc|c} &T & T^c \\ \hline D & P(DT) & P(DT^c) & P(D) \\D^c &P(D^cT) & P(D^cT^c) &P(D^c) \\ \hline & P(T) & P(T^c) & 1 \end{array} $$

Or equivalently, frequency counts out of a million people $$\begin{array}{c|cc|c} &T & T^c \\ \hline D & n(DT) & n(DT^c) & n(D) \\D^c &n(D^cT) & n(D^cT^c) &n(D^c) \\ \hline & n(T) & n(T^c) & 1,000,000 \end{array} $$ And then use your knowledge of probability to fill out the table.


Edit/Update:

The problem is that the false positive rate is $P(T|D^c)$ not $P(D^c|T)$.

The false positive rate is the probability of testing positive given that you don't have the disease. $$ P(T|D^c) = .02$$ The false negative rate is the probability of testing negative given that you do have the disease. $$ P(T^c | D) = .01 $$ Hence we have $P(T | D) = .99$. Now going through some algebra/probability stuff: $$ \begin{align*} P(T)&=P(TD^c) + P(TD)\\ &=P(T|D^c)P(D^c)+P(T|D)P(D)\\ &=P(T|D^c)(1-P(D))+P(T|D)P(D)\\ &=.02(1 - .0002) + .99 \cdot .0002\\ &=.020194 \end{align*} $$ Which matches WHuber

Note: previously I had given you the identity $P(D)=P(D|T^c)P(T^c)+P(D|T)P(T)$, which is true but not useful in this situation.

$\endgroup$
3
$\begingroup$

You're stuck because you are relying on algebra.

Draw a picture. Every application of Bayes' Theorem works like this.

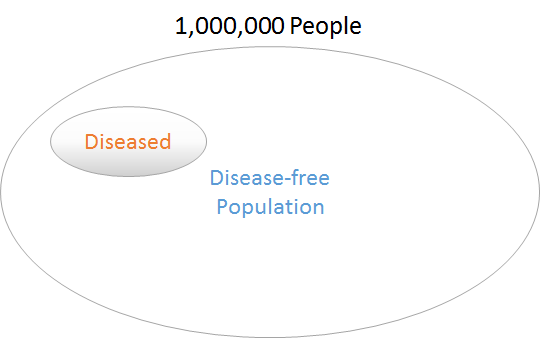
Here is the setup. I chose to show a million people because we will get whole numbers in the end. Of these, some are diseased. I put them into a special group as shown. We are going to move them around--without losing track of any of them--as they get tested.
enter image description here

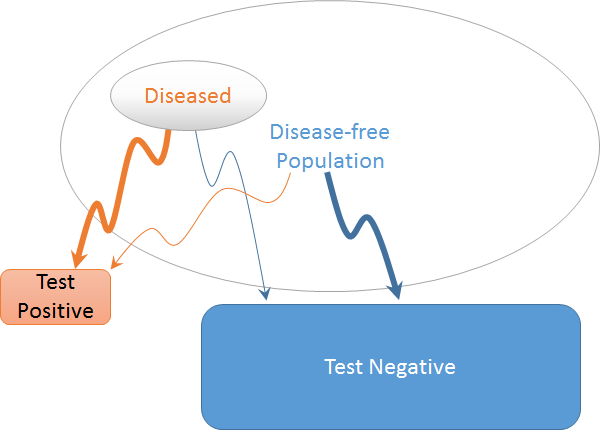
Move the people into areas according to their test results: positive or negative. Some were diseased, some were not. I have drawn four arrows to chart their movements.
enter image description here

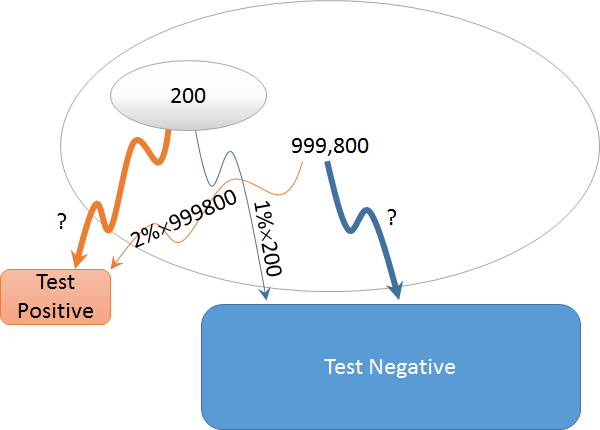
We know some of the numbers. For instance, $0.0002$ of those million people, or $200$ of them, are diseased. The remaining $999,800$ are not. We also know that one percent of the diseased people will have a false negative and two percent of the disease-free people will have a false positive. Because these are pretty rare outcomes, I have made their arrows thin.
enter image description here

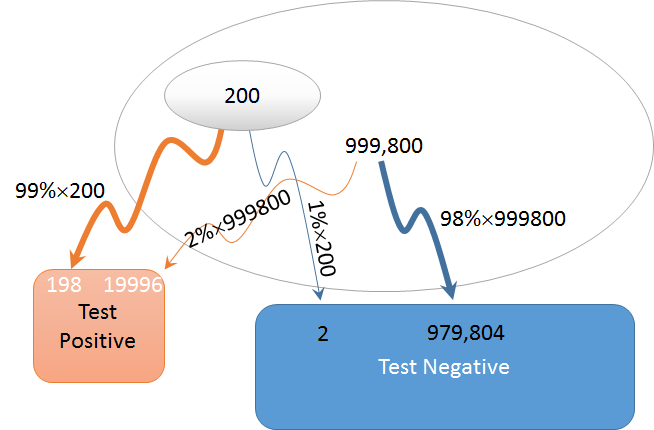
Therefore the remaining $0.99$ of the $200$ diseased people will test positive and the remaining $0.98$ of the $999,800$ disease-free people will test negative. (This is what it means not to lose track of anybody.) These facts are shown with fat arrows to indicate a lot of people pass their way.
enter image description here

It remains only to total those in each test group:
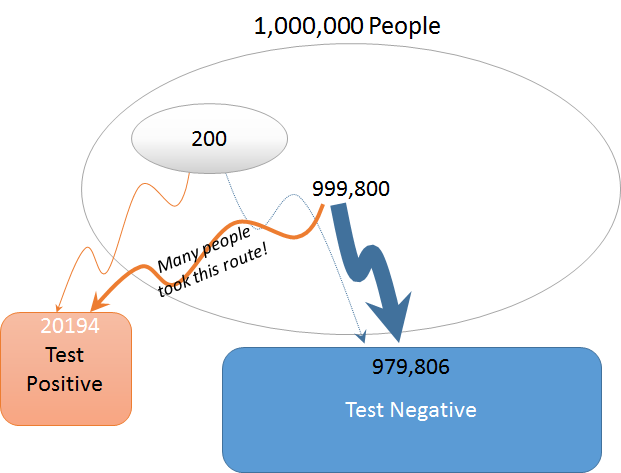
enter image description here

Observe that most of the people in the positive test group came from the disease-free population, because so many people do not have the disease. Being able to see this is the point of the exercise. Unless you are good at math, the algebra only obscures this important realization.

You may read off the answer:

Out of every million people who are tested, expect that $20,194$ will test positive. The chance of a positive test therefore is $$P(T)=\frac{20194}{1000000}=0.020194=2.0194\%.$$

$\endgroup$
2
  • $\begingroup$ I sincerely appreciate you taking the time to write out your response. I do understand how to do it this method as well as the intuition behind it. I'm just curious as to why the algebraic method that I am using is not working. $\endgroup$
    – Joe
    Commented Jun 6, 2016 at 20:37
  • $\begingroup$ Run through this result and turn it into algebra, then, to see where your algebra fails. $\endgroup$
    – whuber
    Commented Jun 6, 2016 at 20:38

Your Answer

By clicking “Post Your Answer”, you agree to our terms of service and acknowledge you have read our privacy policy.

Not the answer you're looking for? Browse other questions tagged or ask your own question.