3
$\begingroup$

I am a science student, however unfortunately a complete newbie in math and statistics. I am measuring soil respiration for my master thesis project and have a certain amount of carbon respired that I have measured over 30 day period. I plotted the respired carbon as a function of time in days and it looks similar to this:
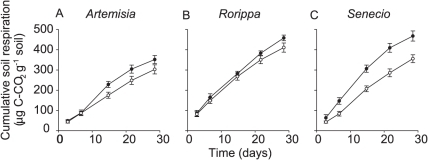
Each data point is a sum of the measured value at a certain day plus value of the previous measurement at a certain day (time). Now, I know how to calculate and report error bars for a basic data, but these are sums of values (cumulative values), so I am wondering how to estimate standard error or deviation for this type of data. How would I calculate and report error bars for my data in this situation?

P.S. This graph is just an example, not my actual data, but it is essentially the same.

$\endgroup$

2 Answers 2

4
$\begingroup$

From basic properties of variance:

$\text{Var}(X_1+X_2) = \text{Var}(X_1)+\text{Var}(X_2)+2\text{Cov}(X_1,X_2)$ and the $k-$variable case can be obtained recursively from that.

$\endgroup$
0
$\begingroup$

You can just calculate the basic data from the cumulative data.

$f_n$ = $F_n$ - $F_{n-1}$

Where $f_n$ denotes the basic data and $F_n$ is the cumulative value

$\endgroup$
1
  • $\begingroup$ Thanks, but I have both a cumulative and basic data sets given. I probably did not make myself clear. What I am looking for is a way to calculate standard deviation or standard error for the cumulative data set. $\endgroup$
    – iirisa
    Commented Jun 30, 2016 at 11:19

Your Answer

By clicking “Post Your Answer”, you agree to our terms of service and acknowledge you have read our privacy policy.

Not the answer you're looking for? Browse other questions tagged or ask your own question.