2
$\begingroup$

I'm trying to implement the algorithm Metropolis Hastings for the next FDP.

\begin{equation} f_{X}(x)=(5+\exp(5/2))*\sqrt{2\pi}\left[\exp\left\{-\frac{(x-2)^{2}-2x}{2}\right\}+5\exp\left\{-\frac{x+2}{2}\right\}\right] \end{equation}

My problem is that I want to analyze the convergence of average, using the strong law of large numbers. However, by construction, I'm getting a unit root process. Am I making a programming error or this is okay?

This is my code.

    rm(list=ls())
    f<-function(x){
      c<-(5+exp(5/2))*sqrt(2*pi) #normalization constant
      (1/c)*(exp(-((x-2)^2-2*x)/2)+5*exp(-((x+2)^2)/2)) #fdp
    }
    integrate(f,-Inf,Inf)
    curve(f(x),-10,10) 

    set.seed(123456)
    nsim<-10^4
    x<-numeric(nsim)
    sigma<-sqrt(1)
    u <- runif(nsim)
    media<-numeric(nsim)
    x[1] <- rnorm(1,runif(1),sigma)
    k<-0
    for (i in 2:nsim) {
      xt <- x[i-1] 
      y <- rnorm(1,xt,sigma) # candidata 
      num <- f(y) * dnorm(xt,y,sigma)
      den <- f(xt) * dnorm(y,xt,sigma)
      if (u[i] <= min(num/den,1)) 
        x[i] <- y else {
          x[i] <- xt
          k <- k+1 # incrementa k porque y fue rechazado
        }
  media[i] <- cumsum(x)/seq_along(x) 
    }

    par(bg = 'gray92')
    plot(media[1000:nsim],type="l", lwd=2, 
         col=8, ylab=expression(bar(x)), xlab="Iteraciones",
         family="serif", main="Media muestral") #convergence of the mean 
    plot(x[6000:6500], type="l")
    hist(x, prob=TRUE, breaks=100, col=2, main="Distribución bimodal", family="serif")
    curve(f(x),-6,6,add=TRUE, lwd=2, col=1)
$\endgroup$
3
  • $\begingroup$ When i plot this: plot(media[1000:nsim],type="l", lwd=2, col=8, ylab=expression(bar(x)), xlab="Iteraciones", family="serif", main="Media muestral"). The mean of the simulated values should convergence, but it does not. $\endgroup$ Commented Jul 3, 2016 at 21:32
  • $\begingroup$ Doesn't it..? I ran your code and at first glance it seems to converge slowly. Have you tried more than 1e4 iterations (this really isn't that much...)? I don't see what exactly is the problem in here... Can you clarify? $\endgroup$
    – Tim
    Commented Jul 3, 2016 at 21:49
  • $\begingroup$ @Tim Yes, I tried it with 90000 iterations and effectively converge. In previous experiments I had used very low or very high values for the variance. I think the problem was that. $\endgroup$ Commented Jul 3, 2016 at 22:38

1 Answer 1

4
$\begingroup$

I do not really think that there is any problem with convergence in here. You are using pretty small number of iterations in here. There are problems where small number of iterations is ok, but for multiple others large number of them is needed. Often it is hard to say how large is large enough.

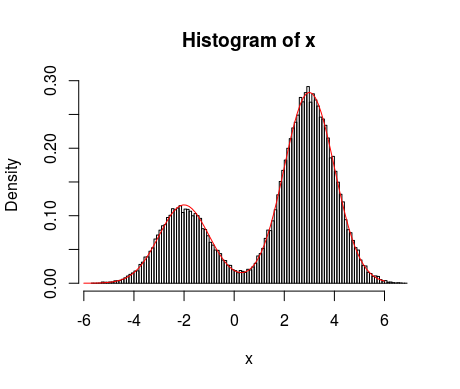
Considering your data, both fit to the density function

enter image description here

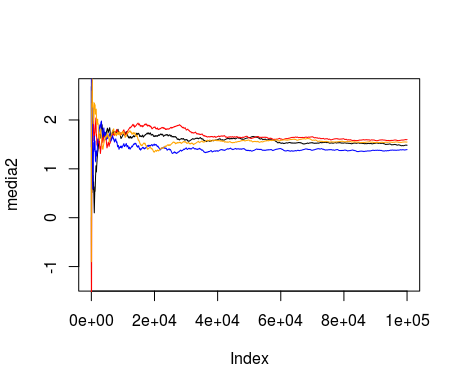
and traceplots of four runs with different seeds

enter image description here

look pretty good as far as you increase number of iterations to $10^5$.

As a side-note: notice that there are cases, like Cauchy distribution, that do not have mean and do not converge.

I have also a programming comment: the media[i]<-mean(x[1:i]) #mean line is useless in your code and slows it down very much, instead you can compute the cumulative means after running it using simply cumsum(x)/seq_along(x), it makes it much faster.

$\endgroup$
2
  • $\begingroup$ in the last plot you used different seeds to study convergence or different variances? $\endgroup$ Commented Jul 3, 2016 at 22:56
  • $\begingroup$ @Héctor I just used different seeds $\endgroup$
    – Tim
    Commented Jul 4, 2016 at 5:21

Your Answer

By clicking “Post Your Answer”, you agree to our terms of service and acknowledge you have read our privacy policy.

Not the answer you're looking for? Browse other questions tagged or ask your own question.