7
$\begingroup$

I have a ton of univariate samples ($x_i \in \mathbb{R}^+$). I'd like an automated method to check for outliers and identify the outliers, if any are present. A reasonable model for the distribution of the non-outliers is a mixture of Gaussians. The number of Gaussians in the mixture and their parameters are not known a priori. Can you suggest a simple method for identifying outliers? Do you have any recommendations? It'd be nice if it were simple to code up in Python.

Something quick and dirty -- say, easy to understand, easy to implement, and pretty effective-- beats something complex but optimal. For example, I'm a bit reluctant to wade into something fancy based upon expectation maximization.

Example parameters: I might have 10,000 samples or so. The distribution of non-outliers might be a mixture of 2 Gaussians; or I might have a mixture of a few hundred Gaussians.

Update: People have asked how anything could possibly be an outlier, given these assumptions. (Presumably, the unstated concern is that this problem may be unsolvable: if every data set is always explainable by some mixture model, then there's no basis to ever identify anything as an outlier.) That's a fair question, so let me try to respond. In my application domain, I can reasonably assume that there will be dozens of samples from each component Gaussian. e.g., I might have 40,000 samples from a mixture of 100 Gaussians, where each Gaussian component has a probability no lower than 0.001 (so it is almost guaranteed that I have at least 10 samples from each Gaussian). I realize I didn't state this assumption earlier, and I apologize for that. However, with this additional assumption, I believe the problem is solvable. There exist examples of data sets where one or more points can be considered outliers (they cannot reasonably be explained by any mixture model). For example, consider a data set that has a single isolated point that is very far from all others: if it's far enough away, it can't be explained by the Gaussian mixture model and thus can be recognized as an outlier. In conclusion, I believe that the problem is well-defined and is solvable (given the additional assumption stated here): there do exist example situations where some points can reasonably be identified as outliers.

Note that I'm not trying to propose a special or unusual definition of outlier. I am happy to use the standard notion of outlier (e.g., a point that cannot reasonably be explained as having been generated by the hypothesized process, because it is too unlikely to have been generated by that process).

$\endgroup$
8
  • $\begingroup$ 10,000 samples how big each? $\endgroup$ Commented Feb 11, 2012 at 9:33
  • $\begingroup$ Each sample is a single real number. The samples are $x_1,x_2,\dots,x_n$, where $n$ might be 10,000 or so, where $x_i \in \mathbb{R}^+$. $\endgroup$
    – D.W.
    Commented Feb 11, 2012 at 17:44
  • 1
    $\begingroup$ Your new definition of an "outlier" really says you're looking for clusters that are unusually small in size. After all, this definition does not stipulate that an "outlier" should be unusually large or small; it only refers to small groups of values that are "far from all others." This suggests you simply apply clustering methods (of which there are many). $\endgroup$
    – whuber
    Commented Feb 11, 2012 at 19:30
  • $\begingroup$ @whuber, I don't understand. Perhaps there's been a miscommunication? I'm not looking for a cluster of outliers, and I'm not saying I expect outliers to appear in clusters. And I didn't intend to provide anything different from the standard definition of outlier. I'm merely pointing out that there are cases when one can clearly identify that a particular point is likely an outlier, despite the fact that non-outliers come from a mixture model. Am I making no sense? $\endgroup$
    – D.W.
    Commented Feb 12, 2012 at 0:05
  • 1
    $\begingroup$ Well, what exactly do you mean by an "outlier" then? It's legitimate to narrow down your current description to include the idea that outliers have extreme values (thereby distinguishing them from inliers). The main purpose of my comment was to suggest that you can exploit cluster analyses (some of which are quick and simple, such as those based on gap statistics) to find all small clusters of outliers and inliers; focusing on those clusters having extreme values will then identify the outliers you seek. $\endgroup$
    – whuber
    Commented Feb 12, 2012 at 21:01

4 Answers 4

8
$\begingroup$

I have suggested, in comments, that an "outlier" in this situation might be defined as a member of a "small" cluster centered at an "extreme" value. The meanings of the quoted terms need to be quantified, but apparently they can be: "small" would be a cluster of less than 10 values and "extreme" can be determined as outlying relative to the set of component means in the mixture model. In this case, outliers can be found with simple post-processing of any reasonable cluster analysis of the data.

Choices have to be made in fine-tuning this approach. These choices will depend on the nature of the data and therefore cannot be completely specified in a general answer like this. Instead, let's analyze some data. I use R due to its popularity on this site and succinctness (even compared to Python).

First, create some data as described in the question:

set.seed(17) # For reproducible results
centers <- rnorm(100, mean=100, sd=20)
x <- c(centers + rnorm(100*100, mean=0, sd=1), 
       rnorm(100, mean=250, sd=1), 
       rnorm(9, mean=300, sd=1))

This command specifies 102 components: 100 of them are situated like 100 independent draws from a normal(100, 20) distribution (and will therefore tend to lie between 50 and 150); one of them is centered at 250, and one is centered at 300. It then draws 100 values independently from each component (using a common standard deviation of 1) but, in the last component centered at 300, it draws only 9 values. According to the characterization of outliers, the 100 values centered at 250 do not constitute outliers: they should be viewed as a component of the mixture, albeit situated far from the others. However, one cluster of nine high values consists entirely of outliers. We need to detect these but no others.

Most omnibus univariate outlier-detection procedures would either not detect any of these 109 highest values or would indicate all 109 are outliers.

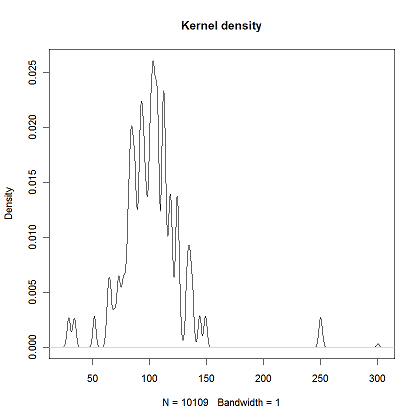
Suppose we have a good sense of the standard deviations of the components (obtained from prior information or from exploring the data). Use this to construct a kernel density estimate of the mixture:

d <- density(x, bw=1, n=1000)
plot(d, main="Kernel density")

KDE

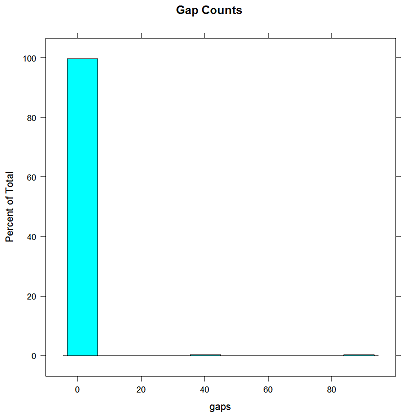
The (almost invisible) blip at the extreme right qualifies as a set of outliers: its small area (less than 10/10109 = 0.001 of the total) indicates it consists of just a few values and its situation at one extreme of the x-axis earns it the appellation of "outlier" rather than "inlier." Checking these things is straightforward:

x0 <- d$x[d$y > 1000/length(x) * dnorm(5)]
gaps <- tail(x0, -1) - head(x0, -1)
histogram(gaps, main="Gap Counts")

Gap histogram

The density estimate d is represented by a 1D grid of 1000 bins. These commands have retained all bins in which the density is sufficiently large. For "large" I chose a very small value, to make sure that even the density of a single isolated value is picked up, but not so small that obviously separated components are merged.

Evidently the gap distribution has two high outliers (which can automatically be detected using any simple procedure, even an ad hoc one). One characterization is that they both exceed 25 (in this example). Let's find the values associated with them:

large.gaps <- gaps > 25
ranges <- rbind(tail(x0,-1)[large.gaps], c(tail(head(x0,-1)[large.gaps], -1), max(x))

The output is

         [,1]     [,2]
[1,] 243.9937 295.7732
[2,] 256.3758 300.9340

Within the range of data (from 25 to 301) these gaps determine two potential outlying ranges, one from 244 to 256 (column 1) and another from 296 to 301 (column 2). Let's see how many values lie within these ranges:

lapply(apply(ranges, 2, function(r){x[r[1] <= x & x <= r[2]]}), length)

The result is

[[1]]
[1] 100

[[2]]
[1] 9

The 100 is too large to be unusual: that's one of the components of the mixture. But the 9 is small enough. It remains to see whether any of these components might be considered outlying (as opposed to inlying):

apply(ranges, 2, mean)

The result is

[1] 250.1848 298.3536

The center of the 100-point cluster is at 250 and the center of the 9-point cluster is at 298, far enough from the rest of the data to constitute a cluster of outliers. We conclude there are nine outliers. Specifically, these are the values determined by column 2 of ranges,

x[ranges[1,2] <= x & x <= ranges[2,2]]

In order, they are

299.0379 300.0376 300.2696 300.3892 300.4250 300.5659 300.7018 300.8436 300.9340
$\endgroup$
2
  • $\begingroup$ This solution seems to be pretty convincing. However, my only question to it is the usage of 1000/length(x) * dnorm(5) as a threshold for the pdf$y values. Could someone kindly explain why use this threshold and why not say >0 condition. Thanks. $\endgroup$
    – user92114
    Commented Oct 14, 2015 at 15:50
  • $\begingroup$ @Lava In other circumstances there may be no actual zeros anywhere--it depends on how long the gaps are relative to the bandwidth. Thus a threshold that is appropriate for the amount of data, their range, and the bandwidth would generally be a better choice than a pure zero. $\endgroup$
    – whuber
    Commented Oct 14, 2015 at 22:23
4
$\begingroup$

I'm not sure I understand the issue here, but the MAD-Median rule:

$\frac{|X-M|}{MADN}>2.24$, where $M$ is the median and $MADN$ is the $\frac{\text{median absolute deviation from the median}}{0.6745}$

is pretty commonly used. Wilcox's WRS package in R has an out() function that fits this and returns the cases to keep and cases to drop, and I'm sure it would be easy to code in other languages. On the face of it this would be an answer to your question - one of many of course because there is a vast literature on outliers.

You may need a more restrictive definition of "outlier", of course. If you are happy with any observations that are consistent with a mixed distribution of 100s of Gaussian variables it is hard to imagine anything being ruled an outlier.

$\endgroup$
7
  • $\begingroup$ Hi @Peter. I am not sure, but I think that formula has a problem of not accounting for sample size. With large samples, even with a single normal distribution, more outliers are to be expected. $\endgroup$
    – Peter Flom
    Commented Feb 11, 2012 at 13:20
  • $\begingroup$ Seems like a useful rule, thanks! I wonder if this rule might have been designed for use with approximately Gaussian data (rather than a mixture of multiple Gaussians). I notice that in some cases it might miss some outliers. e.g., if the mixture is $0.5 \mathcal{N}(30, 1) + 0.5 \mathcal{N}(70, 1)$, then an observation of the value 10 is likely an outlier, but will not be detected by the MAD-Median rule. However, that might be a minor quibble. This rule seems like a nice one to try. Thank you! $\endgroup$
    – D.W.
    Commented Feb 11, 2012 at 17:53
  • $\begingroup$ @PeterFlom, I would imagine that you can just increase the constant $2.24$ a bit to account for the increased sample size. For instance, changing $2.24$ to $3.5$ seems like it might keep the false alarm rate at or below $1/10^6$ (based on the rule of thumb that, for a Gaussian, $MADN$ is a good estimate of $\sigma$; and based upon my speculation that the false alarm rate for a mixture of Gaussians should be even lower than for a single Gaussian). However do tell me if I'm missing something or if I've erred. $\endgroup$
    – D.W.
    Commented Feb 11, 2012 at 18:03
  • 2
    $\begingroup$ Simple deviation methods like these fail when the number of outliers is unknown and can exceed 1. With non-robust criteria, groups of outliers can "mask" their presence by inflating the SD; with robust criteria (like one based on MAD and medians), a large number of non-outlying groups can be identified as "outlying." That will be the case in this problem setup if the SDs of the individual mixture components are small compared to the spread of their centers. $\endgroup$
    – whuber
    Commented Feb 11, 2012 at 19:34
  • 2
    $\begingroup$ @D.W. Let the dataset consist of 100 draws from a Normal$(0,1)$ distribution ($N(0,1)$), 100 from $N(-9,1)$, and 50 from $N(1000,1)$. The median will be around $1$ and the MAD will be around $10$, whence the 50 last draws will have standardized values around $(1000-1)/10 * 0.67)\approx 150$, all of them apparently strong outliers by Peter Ellis's criterion. It makes no sense to declare the top 20% of any dataset to be "outliers," especially when you expect the data to be the mixture you described. $\endgroup$
    – whuber
    Commented Feb 12, 2012 at 20:57
1
$\begingroup$

If your range of possible distributions of non-outliers is so broad, I don't think you can have any outliers. But perhaps you can impose some restrictions on the mixture?

For example, if N = 10,000 and it's a mixture of $\mathcal{N}~(9900, 10, 10)$ and $\mathcal{N}~(100, 50, 100)$ then some very large values would be non-outliers.

In addition, in general, automated searching for outliers can only be a first step.

$\endgroup$
7
  • 1
    $\begingroup$ Thanks. Good points. See my update to the question for more information that explains how you can have outliers. Automated searching: yes, I realize that automated search is only a first step. A human will examine all items that have been flagged as a possible outlier, and there are other ways (out of scope for this question) for identifying outliers. However, I don't want to bother the human too much more than necessary. $\endgroup$
    – D.W.
    Commented Feb 11, 2012 at 17:46
  • $\begingroup$ I don't think the additional restriction really solves things enough to make the problem solvable in an automated way. Look at my example. x <- c(rnorm(9900,10,10), rnorm(100,50,100)) quantile(x, .999) x[x>175] The first time I tried this, I got a maximum of 317.8, and a 2nd highest of 233, then things were tightly bunched. Is 317 "far" from 233? I think so. But it's a combination of 2 normals $\endgroup$
    – Peter Flom
    Commented Feb 11, 2012 at 21:58
  • $\begingroup$ I don't understand why you think your example proves the problem is not solvable. In your example, presumably fancy methods like EM could reconstruct the parameters of the mixture model (100 observations from the $\mathcal{N}(50,100)$ distribution should be plenty), compute $p$-values for each observed value, and then identify outliers. (In your example, once we know the parameters, 317 is only 2.7 standard deviations above the mean 50, so not an outlier.) So it seems it should be possible to detect outliers. I don't follow why you've concluded it is impossible. $\endgroup$
    – D.W.
    Commented Feb 12, 2012 at 0:21
  • $\begingroup$ I don't see how EM could reconstruct the mixture model, if told only that it is a combination of normal distributions. Maybe it could, but I don't see how it could do so precisely. And something that is an outlier from one mixture of normals would not be an outlier from another mixture of normals. $\endgroup$
    – Peter Flom
    Commented Feb 12, 2012 at 12:48
  • 1
    $\begingroup$ I think the key to resolving this is the implicit criterion that each mixture component has enough probability to guarantee that it contributes a large number (10 or more, e.g.) of the data. Then isolated clusters (of one to nine points) identified by fitting a mixture model would violate this assumption and constitute either "outliers" (for extreme values) or "inliers" (for non-extreme values). $\endgroup$
    – whuber
    Commented Feb 12, 2012 at 21:05
1
$\begingroup$

The most elegant solution I can think of is a mixture of Gaussians model, in which you have k Gaussians corresponding to your signal (with a prior encouraging their variances to be reasonably small), and 1 diffuse Gaussian capturing the outliers ("diffuse" means huge variance), where you specify the prior proportion of outliers (e.g. 1%) in a Dirichlet prior. If you don't want to do EM, you may consider using k-means as a warm-start, and then optimize iteratively, where the slow step is the optimization of the discrete cluster assignments. But if the (co)variances of the signal Gaussians are approximately equal, this means that most reassignments will be to/from neighboring clusters, or to/from the outlier cluster.

$\endgroup$

Your Answer

By clicking “Post Your Answer”, you agree to our terms of service and acknowledge you have read our privacy policy.

Not the answer you're looking for? Browse other questions tagged or ask your own question.