3
$\begingroup$

I am working on Approximate Bayesian Computation for a simple regression model. Currently, I am not sure how a distance metric in the setting of regression analysis should look like.

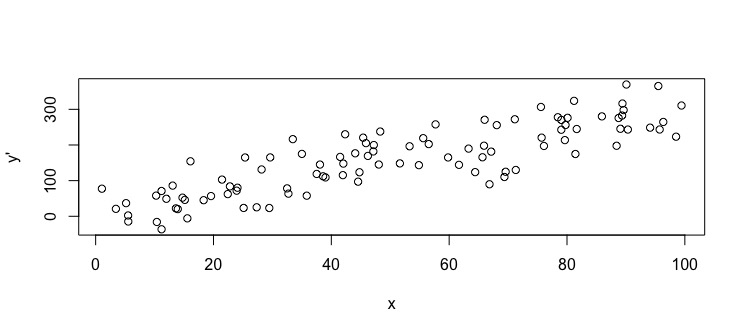
Imagine a simple linear regression and the corresponding scatterplot.

set.seed(123)
x = runif(100,1,100)
y = 2 + 3*x + rnorm(100,0,50)
plot(x,y)

Scatterplot 1

Assuming that the underlying data-generating model is a regression model with a specific intercept and slope, I would like to evaluate another set of datapoints (calles y') and assess how likely this new sample was generated by the same underlying model.

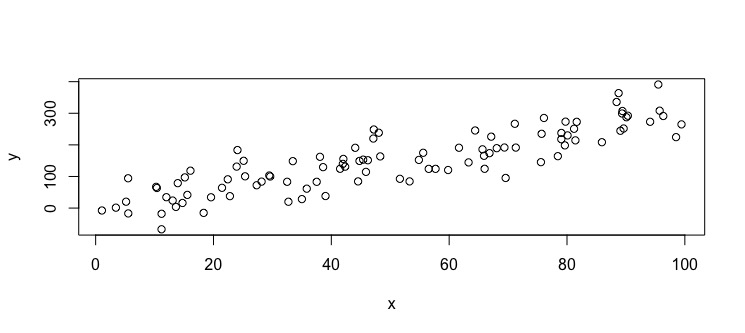
So, this (see below) new sample (y') should be judged as being similar to the one before (y) since it is generated by the same underlying model:

set.seed(456)
y = 2 + 3*x + rnorm(100,0,50)
plot(x,y,ylab="y'")

Scatterplot 2

Note that the x-values stay the same, so the distance metric should only be concerned with the distance between the y-values (distance between y and y'). One way to judge the distance between two samples might be a correlation coefficient but unfortunately it is not an appropriate metric. The pure sum of squared distances between the y-values is not correct either. If you simply add to each y a small amount then the sum of squared distances between the old values (y) and the new ones (y') is small but the underlying model changes (the intercept is shifted by the amount added to the datapoints).

Is there any metric that is suitable for the scenario I described?

EDIT

Previous approaches:

It it reasonable to draw any intercept and slope, 'add' this line into the first scatterplot and evaluate the distance as the sum of squared residuals. If this distance-measure is small, then the line that was chosen fits to the data well.

But:

Although this approach is not wrong, I cannot estimate the residual variance $\sigma$ as a parameter (as it is estimated in maximum likelihood estimation procedures). If I'm correct, in order to be able to estimate $\sigma$ as well, I have to somehow judge the similarity between the actual datapoints y and y'.

$\endgroup$
2
  • $\begingroup$ I do not follow why do you consider SSE a wrong metric? It is used for OLS regression, so why it should be wrong here? Obviously "shifted" data leads to "shifted" estimates of parameters, but isn't it what you are after? Don't you want to account for uncertainty connected with the model? $\endgroup$
    – Tim
    Commented Sep 28, 2016 at 9:09
  • $\begingroup$ See my edit. I am not sure if I understand you correctly but I don't mean the usual SEE (distance between line and datapoints - residuals) but the distance between datapoints (here y and y'). The problem with this metric is that a small distance would not strictly imply that the new sample comes from the same model. $\endgroup$
    – beginneR
    Commented Sep 28, 2016 at 9:26

1 Answer 1

2
$\begingroup$

You are looking for a sufficient statistics to parametrize y = a * x + b + N(0,sd)

The easiest option I can think of is fitting an lm and use the estimates + residual error as summary statistics (make sure to normalize them before calculating the final distance).

The idea of using the parameter estimates of a simple model as summary statistics goes back to the idea of "indirect inference". In this example, it looks a bit pointless because you use the lm estimates to create ABC lm estimates, but note that this would still work if the model to be fit is not an lm, but something else that only produces a similar response and is therefore well summarized by an lm.

$\endgroup$
4
  • $\begingroup$ Thanks, so you mean that the final distance is actually a cosine/euclidean distance between two normalized vectors? $\endgroup$
    – beginneR
    Commented Oct 20, 2016 at 8:00
  • $\begingroup$ Well, there is certainly room for more research on the optimal distance measure (and there are quite a few papers to read), but a simple choice is to normalize the summaries with their variance over the prior space and then take the euclidean distance. I guess this works OK as long as the summaries are relatively independent. $\endgroup$ Commented Oct 20, 2016 at 8:37
  • $\begingroup$ And you have 3 vectors, right? 3 parameters. $\endgroup$ Commented Oct 20, 2016 at 8:38
  • $\begingroup$ A vector with 3 elements (parameters) for both observed and simulated data. $\endgroup$
    – beginneR
    Commented Oct 20, 2016 at 8:54

Your Answer

By clicking “Post Your Answer”, you agree to our terms of service and acknowledge you have read our privacy policy.

Not the answer you're looking for? Browse other questions tagged or ask your own question.