This is the first time I'm posting a question here. I have regularly been using the questions and answers here as example solutions for my problems, and searching has always helped me figure things out. So thanks for that :) But this time I think I'm starting to understand, but I am still not 100% sure of what to do, so I figured I'd try to make a post.
I'm working on a field experiment that has been running for many years. The Treatments are measured once a season, so I understand this should be analyzed as repeated measures. I have seen several examples, such as here, here, and here, but I get confused with especially how to define the error term.
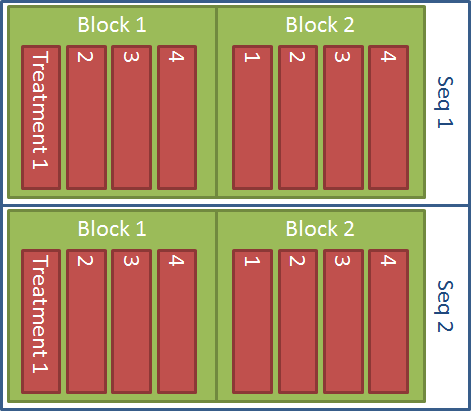
My experiment exists of several factors, in what I interpret as a strip-plot design. But maybe it should be interpreted as a split-plot instead. Anyway, I've made a simplified picture below. My factors are (from small to large):
- Treatment (subplots) - input applications, and the main interest
- Block - replication
- Sequence (Seq, whole plot). Could be interpreted as a rotation.
- Years (seasons)
Thus, I interpreted the blocks as nested in Seq, and Treatment nested in Blocks. But maybe it should be the other way around i.e. all blocks were split in Seq 1 and 2, and Treatment is nested in Seq? Honestly, the sequences kind of only complicate things, as they are basically just a historical artifact. They can be hypothesized to not be different, but this would still have to be confirmed.
Every year samples were taken from all treatments in both sequences. However, what complicated things is that unfortunately for some years samples have partially gone missing i.e. I only have data for one of the two sequences (so the data is unbalanced - the joy of long-term experiments :)).
My interest is: - Are the treatments different? - Is the response different in different years? - (If so,) are there any temporal trends (increase or decrease of response of a treatment over time)? - Do the sequences indeed not matter?
Apart from the sequences not being different, I hypothesize that the treatments are indeed different, but that there are no temporal trends.
Based on what I've read so far, I'm considering the lme function, but I'm not yet sure how to build the model:
#loaded data file from csv.

data$Treatment <- factor(data$Treatment, levels=Treatment.codes)
data$Block <- factor(data$Block)
data$Sequence <- factor(data$Seq)
data$Year <- factor(data$Year) #or try simple linear?

m1 <- lme(Response ~ Year * Treatment + Sequence + Block, random=~1|Sequence/Block/Treatment, data)

m2 <- lme(Response ~ Year * Treatment + Sequence + Block, random= ~ 1|Block/Sequence/Treatment, data)
Could someone shine a light on whether this is the right way to approach this, or whether I'm going at this completely in the wrong way (lme, or should I stick to aov). If so, is the random error term of either m1 or m2 correct according to my experimental design? I'm particularly confused about how to place the blocking.
p.s. the next challenge will be the analysis itself and its interpretation. I am reading some more already, but any additional pointers there are always welcome too :)

