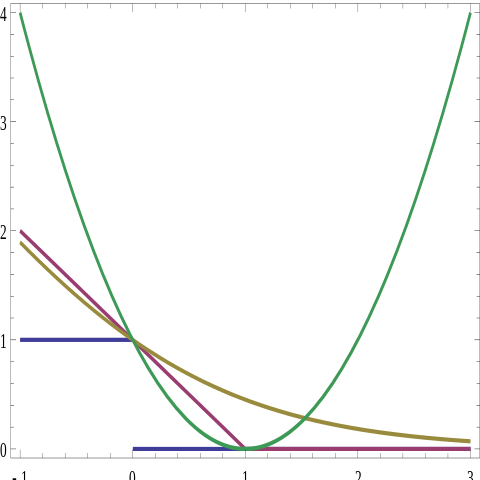
Quoted from the Wiki article:
For computational ease, it is standard practice to write loss functions as functions of only one variable. Within classification, loss functions are generally written solely in terms of the product of the true classifier $y$ and the predicted value $f(\vec{x})$
In other words, you're plotting the loss against the univariate quantity $y f(\vec{x})$. The article is assuming that $y$ can take on the values 1 or -1 so that quantity allows you to have one plot for the loss regardless of what $y$ is.
Remember that $f(\vec{x})$ is the output of your classifier, which doesn't have to be -1 or 1, or even a probability. It's just a function. To see how you get the curves, plug in a few values of $f$ for each value of $y$ and see what it looks like.
Edit:
Hopefully this better explains the range. The loss is not restricted to be in the same range as the data itself. It is something that we define and varies depending on how we compute it. For example, if we use 0-1 loss, the loss is 0 if we match the label and 1 otherwise, there is no measure of distance.
Now, suppose that $f(\vec{x})$, returns an estimate $\hat{P}\left(y = 1 ~ | ~ \vec{x}\right)$ of the conditional probability $y=1$ as a function of our covariates. We could call it 1 if this is $> 0.5$ and -1 otherwise, but that's very coarse. Maybe we want to penalize the classifier less for being a "little bit" wrong than if it's confidently wrong - for instance saying the probability of 1 is 0.01 when in fact it was a 1.
The other loss functions allow us to take this into account. Also, notice that in the example you provided it is assuming that $f$ isn't a probability, but rather scaled to be between -1 and 1.
for square loss we use $(1 - y f(\vec{x}))^2$. If $f$ has the same sign as $y$ and magnitude 1, it is 0. If it has magnitude 1 and the opposite sign we get 4 (because inside we have $1 - -1$).
In general, you can have more or many different loss functions and output functions from your classifier. Usually, though, we'll deal with $f$ where it is estimating conditional class probabilities and lies in $[0, 1]$ or is scaled to $[-1, 1]$ which is the same thing. Which loss function we use depends on the problem we are trying to solve as well as our tastes. Some work better in certain situations than others and as far as I know it's tough to directly compare the output of different loss functions meaningfully.

