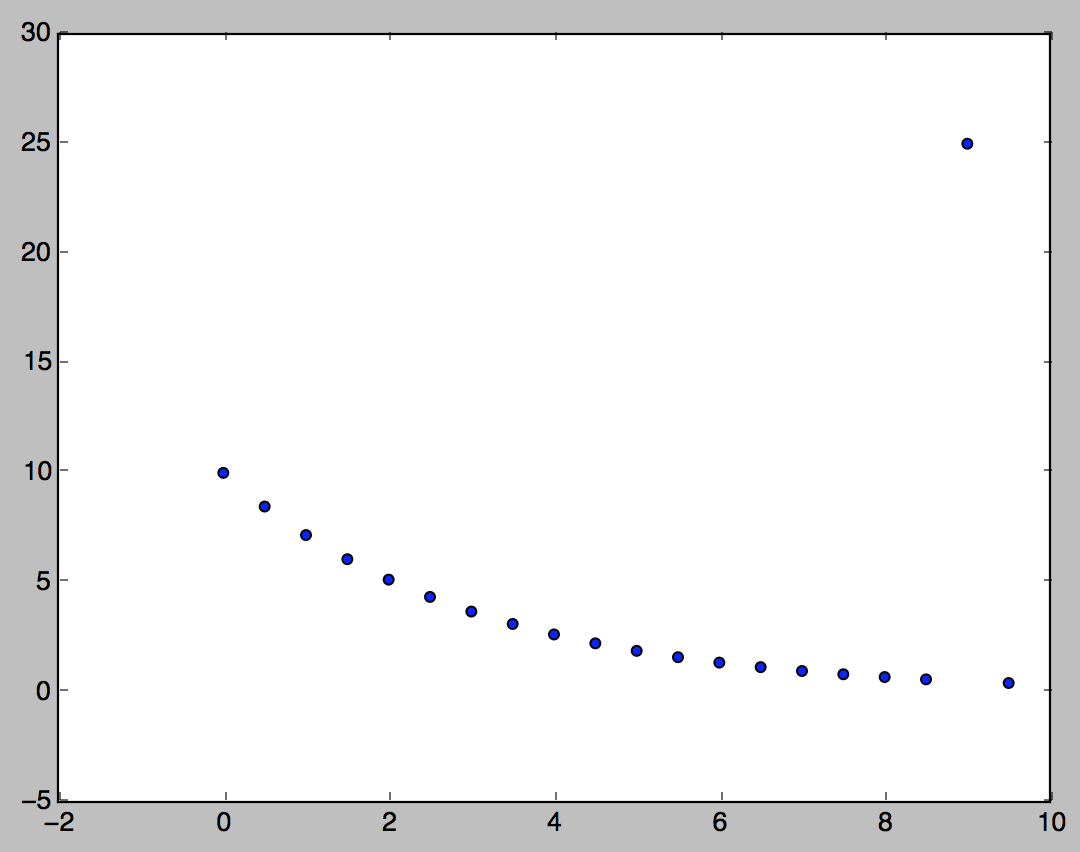
Is there a way to detect outliers in data that would fit a non-linear shape? For example, I have data that fits an exponential decay with an obvious outlier. I have simulated data with an example of this:
I want to know the index locations of where these outliers occur in the real data and currently I am doing this by applying an exponential decay fit to the data then finding the residual of each point the fit. I then find if any points go over a certain threshold that I find as some multiple of the standard deviation of the residuals and find any point with a residual over that threshold. Is there a better way to find outliers in a model like this?
Here are the points used in the above array:
 [10., 8.46481725, 7.16531311, 6.0653066,
 5.13417119, 4.34598209, 3.67879441, 3.11403224,
 2.63597138, 2.2313016 , 1.88875603, 1.59879746,
 1.35335283, 1.14558844, 0.96971968, 0.82084999,
 0.69483451, 0.58816472, 25, 0.42143844]

