1
$\begingroup$

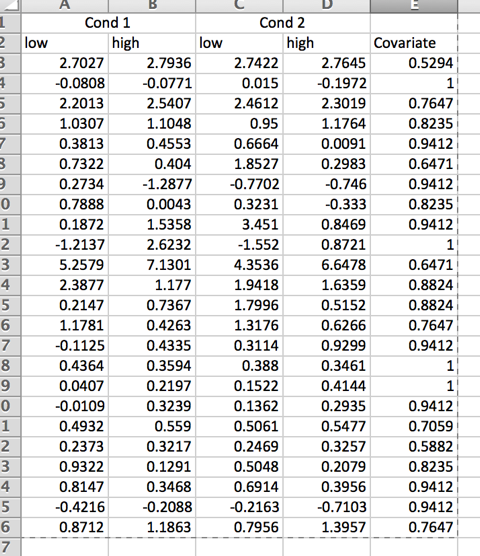
I am analyzing data (see image below) from an fMRI experiment. The dependent variable is activation values (continous) from a specific brain site. There are two conditions, each with two levels of a manipulation (2x2). There is also a covariate (a behavioral measure for how well they the participants did in a behavioral task).

What I want to do is to test for an interaction for how much the two levels (low & high) for each condition correlate with the covariate. I was told that testing for the homogeneity of regression slopes in ANCOVA can help me answer this question. What I want to see is if the regression slope differences between low & high, differ for Cond 1 compared to Cond 2 (e.g., slopes are similar (between low & high) for Cond 1, but differ for Cond 2, which should be considered an interaction).

I am definitely not a stats wiz, and I am new to R. I checked many forum posts, but the data set used in each experiment differed from mine, so it was hard to interpret the solutions (most include group, where my data is repeated measures). How can I test for the interaction I mentioned in R? Thanks a lot in advance.

enter image description here

$\endgroup$
5
  • $\begingroup$ Are the factors in your 2x2 design between- or within-subjects? $\endgroup$
    – Mark White
    Commented May 11, 2017 at 3:54
  • $\begingroup$ Within-subjects. $\endgroup$
    – fsoylu
    Commented May 11, 2017 at 13:16
  • $\begingroup$ OK, cool. One more thing: Could you post the data in a way that would let me easily put it into R? Not as a picture, but as text. $\endgroup$
    – Mark White
    Commented May 11, 2017 at 14:00
  • $\begingroup$ Tried it in the original post but couldn't find a sane way of doing it, with the proper table formatting. Here is a link to the csv file that has the table: alabama.box.com/shared/static/… . Thanks. $\endgroup$
    – fsoylu
    Commented May 11, 2017 at 15:59
  • $\begingroup$ Per this link, stats.stackexchange.com/questions/278460/… why not just do a multiple regression? $\endgroup$
    – Josh
    Commented May 11, 2017 at 16:19

1 Answer 1

1
$\begingroup$

First, you aren't really "testing for homogeneity"; you are testing for an interaction, it seems.

One option for a solution is a linear mixed model. You need to reshape the data from wide to long format first. And then you can run a model predicting the outcome variable (measurement) by the condition (cond), level (level), and covariate (cov). Code is below. I specified cond and level to be random effects, but you could try to specify the random effects structure differently with different nested model comparisons (I laid out elsewhere here).

You could also do a within-subjects ANCOVA, but I prefer linear mixed models. They are more flexible and can handle when the covariate is related to the other factors (I'm not sure if the other factors were measured or manipulated).

> widedat <- read.csv("/Users/markiiwhite/Downloads/dat.csv") # reading in data
> widedat$id <- as.factor(dat$id) # making id a factor
> head(widedat) # checking out data
  id    c1lo    c1hi   c2lo    c2hi    cov
1  1  2.7027  2.7936 2.7422  2.7645 0.5294
2  2 -0.0808 -0.0771 0.0150 -0.1972 1.0000
3  3  2.2013  2.5407 2.4612  2.3019 0.7647
4  4  1.0307  1.1048 0.9500  1.1764 0.8235
5  5  0.3813  0.4553 0.6664  0.0091 0.9412
6  6  0.7322  0.4040 1.8527  0.2983 0.6471
> 
> library(tidyr) # loading package to convert to long format
> longdat <- gather(data=widedat, key="condition", value="measurement", 
+                   c(c1lo, c1hi, c2lo, c2hi), factor_key=TRUE) # converts data from wide to long...
> # ...responses in each condition (condition 1 hi, condition 2 hi, condition 1 lo, condition 2 lo)...
> # ...recoded into a value named "measurement," with a key variable called "cond"
> longdat$cond <- factor(ifelse(longdat$condition=="c1lo" | longdat$condition=="c1hi", "one", "two"))
> longdat$level <- factor(ifelse(longdat$condition=="c1lo" | longdat$condition=="c2lo", "low", "high"))
> # condition into two factors: cond and level  
> longdat <- longdat[,-3] # getting rid of superfluous condition variable
> head(longdat[order(longdat$id),]) # matches the values of the data above
   id    cov measurement cond level
1   1 0.5294      2.7027  one   low
25  1 0.5294      2.7936  one  high
49  1 0.5294      2.7422  two   low
73  1 0.5294      2.7645  two  high
2   2 1.0000     -0.0808  one   low
26  2 1.0000     -0.0771  one  high
> 
> library(lmerTest) # loading package for satterthwaite dfs
> library(lme4) # package for multilevel models
> model <- lmer(measurement ~ cond + level + cond*level + cov + (1 + cond + level|id), longdat)
> # measurement predicted by condition (1 or 2), level (high or low), and the covariate (cov)
> # specified random effects for cond and level, nested within id
> summary(model)
Linear mixed model fit by REML 
t-tests use  Satterthwaite approximations to degrees of freedom ['lmerMod']
Formula: measurement ~ cond + level + cond * level + cov + (1 + cond +      level | id)
   Data: longdat

REML criterion at convergence: 226.7

Scaled residuals: 
    Min      1Q  Median      3Q     Max 
-2.9676 -0.3400 -0.0879  0.2729  3.2985 

Random effects:
 Groups   Name        Variance Std.Dev. Corr       
 id       (Intercept) 1.98441  1.4087              
          condtwo     0.07425  0.2725   -0.50      
          levellow    0.64150  0.8009   -0.75  0.95
 Residual             0.19626  0.4430              
Number of obs: 96, groups:  id, 24

Fixed effects:
                 Estimate Std. Error      df t value Pr(>|t|)    
(Intercept)        5.3721     1.3261 23.2600   4.051 0.000486 ***
condtwo           -0.1114     0.1395 46.8600  -0.799 0.428558    
levellow          -0.1631     0.2076 34.0900  -0.786 0.437314    
cov               -5.2231     1.5316 22.0800  -3.410 0.002499 ** 
condtwo:levellow   0.2675     0.1809 46.0000   1.479 0.146004    
---
Signif. codes:  0 ‘***’ 0.001 ‘**’ 0.01 ‘*’ 0.05 ‘.’ 0.1 ‘ ’ 1

Correlation of Fixed Effects:
            (Intr) condtw levllw cov   
condtwo     -0.088                     
levellow    -0.158  0.580              
cov         -0.974  0.000  0.000       
cndtw:lvllw  0.034 -0.648 -0.436  0.000
$\endgroup$
4
  • $\begingroup$ maybe I am being naive, but why not just do a multiple regression with the Covariate as the dependent variable and all the others as independent variables?You could also add the interaction terms between the independent variables in the regression model. I don't see why this is worse then Mixed Linear Model in this case. $\endgroup$
    – Josh
    Commented May 14, 2017 at 19:14
  • $\begingroup$ Both factors are within-subjects, not between. $\endgroup$
    – Mark White
    Commented May 14, 2017 at 19:33
  • $\begingroup$ Ah, so since it is within-subject and not between, there will be alot of interaction, and thus it is better to use a mixed model, correct? $\endgroup$
    – Josh
    Commented May 14, 2017 at 19:59
  • $\begingroup$ The standard regression assumes observations are independent of one another. Since people are within all 4 conditions, the non-independence of those observations (i.e., they are all from the same person), needs to be modeled. One way to do this is a multilevel model. $\endgroup$
    – Mark White
    Commented May 14, 2017 at 20:09

Your Answer

By clicking “Post Your Answer”, you agree to our terms of service and acknowledge you have read our privacy policy.

Not the answer you're looking for? Browse other questions tagged or ask your own question.