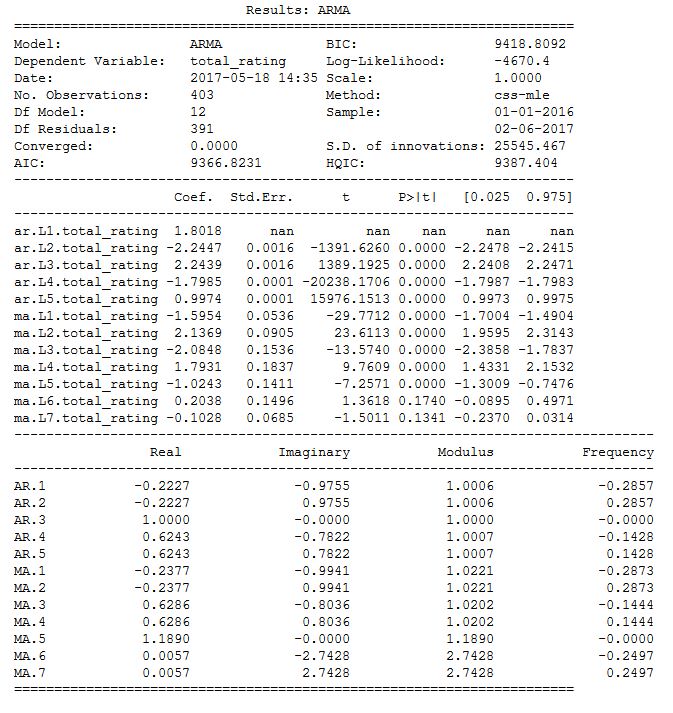
I am new in python time-series analysis. My target is to use the libraries in python to learn the parameters. When I get the parameters I can built equitions and use the model to any other programming language. Keeping it in mind, I bult an ARMA model using the following code and got the following summary using the summary2 method of ARMA model.
import pandas as pd
from statsmodels.tsa.arima_model import ARMA
from statsmodels.tsa.stattools import adfuller, arma_order_select_ic

ts = pd.Series(df2.total_rating, index=df2.index, )
model = ARMA(ts, order=(5, 7)) #5,7 is decided using arma_order_select_ic method
results = model.fit(trend='nc', method='css-mle')
print(results.summary2())
My target is to get all the parameters shown in the following equation image of an ARMA model. As far I understand that for my case,$p$=5, $q$=7, $a_i$ = coef for ar.$L_i$, $X_{t-i}$ = values from the time series data, $b_i$ = coef for ma.$L_i$, and $E_{t-i}$ = Std.Err from ma.$L_i$. But I am confused where to get the value of $c$ and $\epsilon$$_t$?
Please let me know if my above assumptions are correct and also how to get value of c and $\epsilon$$_t$ from the summary?
Edit:
Consider the given time series data:
date    total_rating
13-01-2016  316964
14-01-2016  353527
15-01-2016  334453
16-01-2016  221652
17-01-2016  198445
19-01-2016  331156
20-01-2016  328149
21-01-2016  ?
If I run the following python code, the predicted value for 21-01-2016 is 343003.648569:
predictedDF = results.predict(start='01/01/2016', end='03/02/2017')
My question is how this predicted value is calculated from the equation and the results summary given above. It will be a great help if you kindly put the values in the equation and show me the calculation. Thanks in advance.


