4
$\begingroup$

I'm trying to fit an ARMA(1,0) model for a timeseries that start at $10$ and drops slowly to $4$ in around $180$ steps. For this, I've tried to fit an ARMA model in python using the following:

# contrived dataset
data1 = data['beta_0'].tolist()

# fit model
model = ARMA(data1, order = (1,0))
model_fit = model.fit()

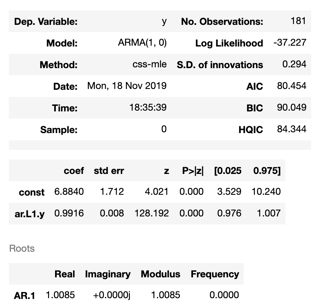
The results are as follows:

enter image description here

I'm having trouble understanding why the constant would be so big. Wouldn't this mean that if you say for instance that $y_0 = 10$ (as it is in my time series), then $y_1 = 6.8840 + 0.9916y_0 + \epsilon$. I would assume that then the values of this time series would blow up right?

Then how can it be that this is the output for a series that drops slowly from 10 to 4?

Any help would be much appreciated.

$\endgroup$

1 Answer 1

3
$\begingroup$

Your equation is

$$[y(t)-6.8840][1-.9916B]= +ϵ(t)$$

or

$$y(t)= .0084\times6.8840 + .9916\cdot y(t-1)$$

$$y(t)= .0578 + .9916\cdot y(t-1)$$

enter image description here

What has you confused is for your stationary model the constant that is estimated is a Left-Hand side constant not the right-hand side that you were (normally !) expecting.

Your model in my opinion should be changed to a first difference model as your ar coefficient is not different from 1.0 .

EDITED AFTER COMMENTS BY @whuber:

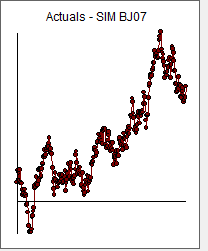
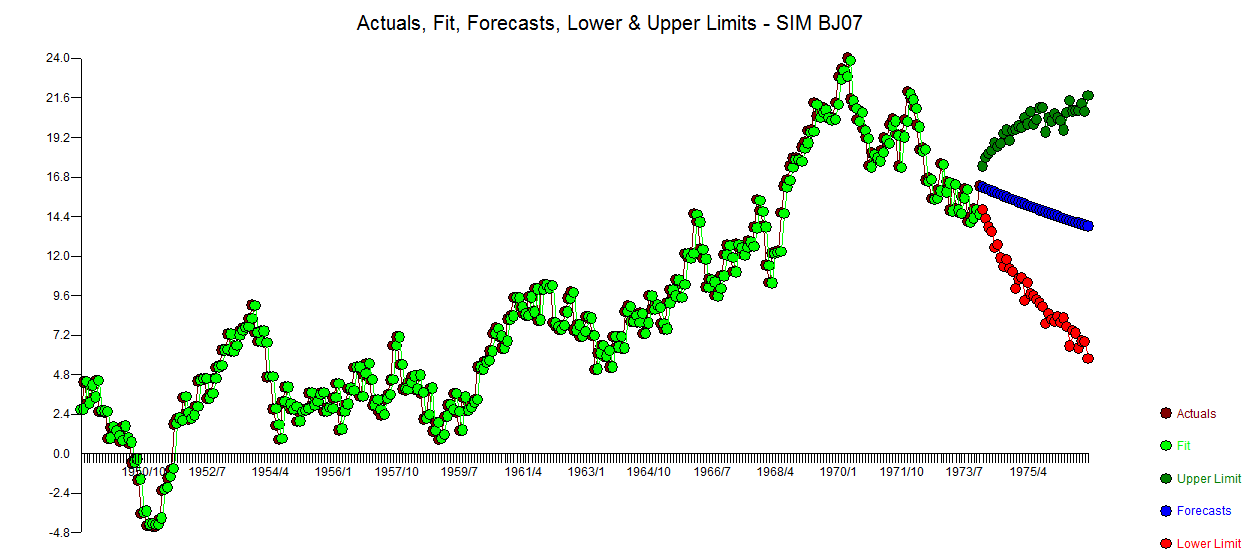
I was intrigued by the interesting discussion and decided to roll out my trusty time series simulator enter image description hereand generated a realization of the following model enter image description here . The nature of the model suggests that other realizations could be expected to have different patterns.

The series has its up's and down's much like what might be expected from a process where the expected value is the last value more or less.

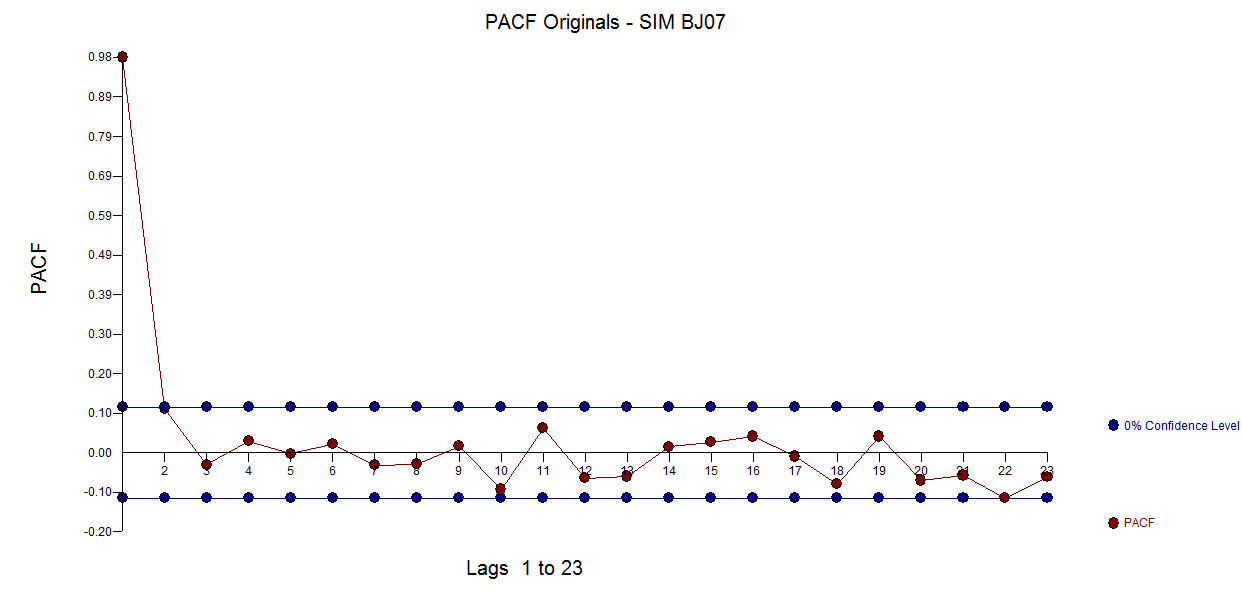
The ACF and PACF are here

enter image description here

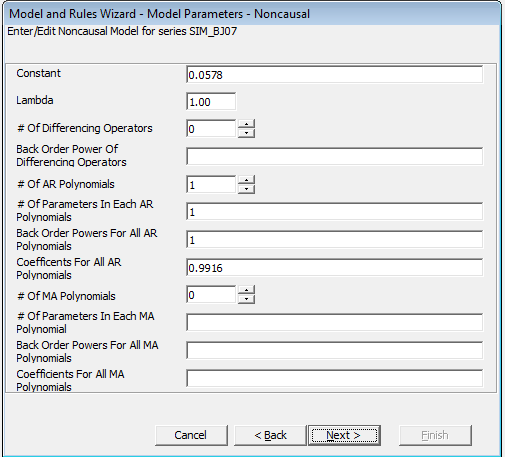
The estimated model is here enter image description here and here (with a non-significant BUT necessary constant ) enter image description here

Expressed as a pure right-hand side equation here enter image description here

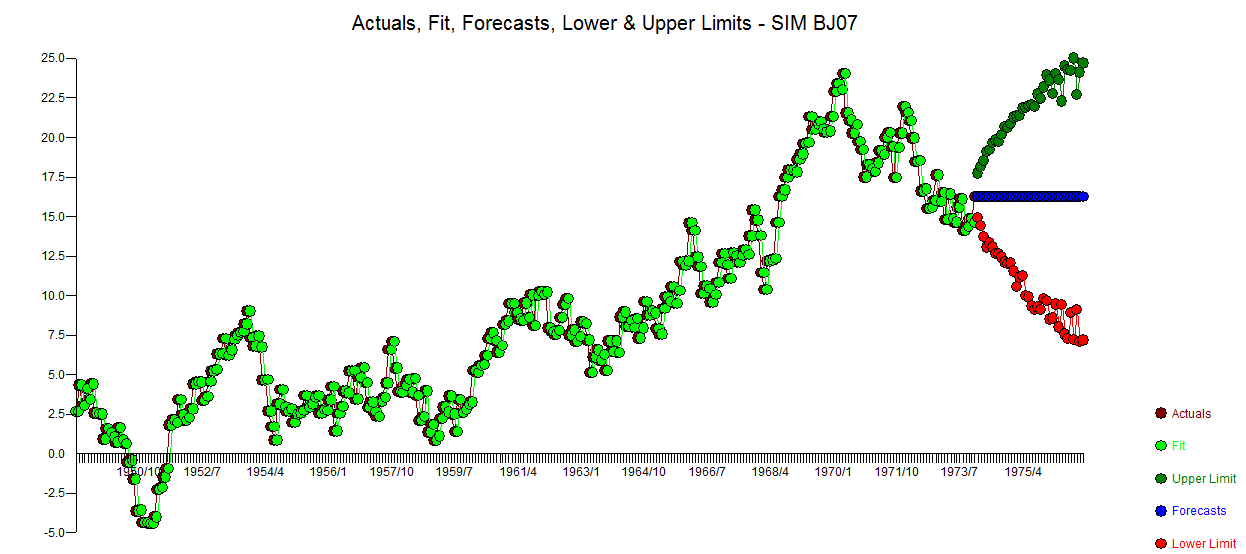
The ACTUAL/FIT/FORECAST graph is here enter image description here

The history shows trends up and down for different segments .

Treated objectively the model is simply a random walk enter image description here

$\endgroup$
4
  • 1
    $\begingroup$ Your formula doesn't match the conventions used by Statsmodels: see stats.stackexchange.com/questions/280507. I agree that the output indicates the advisability of first-differencing, but the short answer is that this looks like a random walk and, since the innovation variance is estimated as $0.294^2=0.0684,$ over the course of $180$ independent steps the variance of the total change is $15.56,$ indicating a typical change of $\sqrt{15.56}\approx 4.$ This value and the estimated constant of $6.88$ are perfectly consistent with data ranging from $10$ to $4.$ $\endgroup$
    – whuber
    Commented Nov 18, 2019 at 21:15
  • $\begingroup$ a random walk is a particular case of a first difference model allowing for a possible drift parameter or even arma structure. In my parlance a random walk is a first difference model without drift and without arma structure ... this data suggests drift which may not be significant. I pursued your suggested thread but as usual I am (slightly) confused . Are you sure your url is correct ? $\endgroup$
    – IrishStat
    Commented Nov 18, 2019 at 21:47
  • $\begingroup$ I apologize: the final digit of the question number got cut off during the copy-and-paste operation. I have restored it. It should link to a thread titled "Generating equation from python ARMA model summary." $\endgroup$
    – whuber
    Commented Nov 18, 2019 at 21:48
  • $\begingroup$ it would appear that their general expression is inconsistent with the reported/estimated constant C . The OP's reflection about the series blowing up is correct while if one uses .0578 (which may not be statistically significant) the series will blow up slower. I surmize from his "dropping slowly" reflection that there may be outliers in the series that are falsely imputing a positive but not significant positive drift from 10. to 4. . His model's forecast converge to an assymptote as ultimately the ar effect dies out. If the last value is near 4.the limiting value will be close to 4 .... . $\endgroup$
    – IrishStat
    Commented Nov 18, 2019 at 22:32

Your Answer

By clicking “Post Your Answer”, you agree to our terms of service and acknowledge you have read our privacy policy.

Not the answer you're looking for? Browse other questions tagged or ask your own question.