If what you wanted to do could work you could do it with any number of $a_i$ values and so $a$ and $b$ would be identifiable. But it doesn't.
Assuming that the density would be defined over the reals above some lower bound, the density for $X$ would be $k x^{-2},\, \text{ for } x\geq k$, where $k$ is the only parameter.
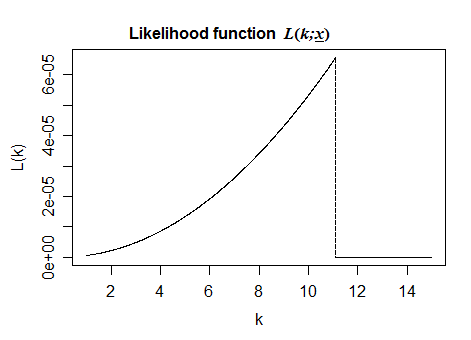
You can estimate $k$ by various means (the likelihood is maximized when $k=x_{(1)}$, the smallest observation).
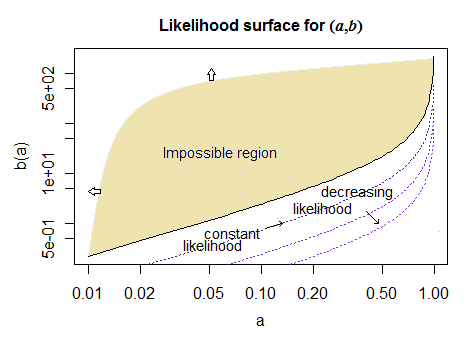
If you knew $a$ you could get $b$ by ML, but it's exactly the same as estimating $k$ and working $b$ out from $a$ and $k$. If you try several different $a$ values, they'll all go with the same $k$ - and the same likelihood. So you'll get different $b_i$s to go with your different $a_i$s, but the likelihood at the maximum will be identical. There's a curve in $(a,b)$ space along which the likelihood takes exactly the same maximum value -- the one corresponding to ML for $k$. Specifying a couple of $a_i$ values just picks a couple of points on the curve.
(Note that this ML value is at the boundary of the parameter space for $k$)
For a particular sample $(x_1=11.1,\,x_2=123.4)$, we get something like this:

If we plot the likelihood surface as a function of $a$ and $b$ we get something like this (here I assumed you wanted $0<a<1$ rather than larger values where $b$ would be negative):

The axes for $a$ and $b$ here are log-scaled (the tick-mark labels are original scale). The black curve is the curve that results in the highest value of likelihood. It corresponds to $k=11.1$, where the likelihood for $k$ was maximized. If you choose any value for $a$, like $a=a_1$ say then you can increase the likelihood by choosing larger $b$ right up until you hit the boundary, which corresponds to the MLE (and largest possible value) for $k$.


