0
$\begingroup$

I have two vectors that look like this:

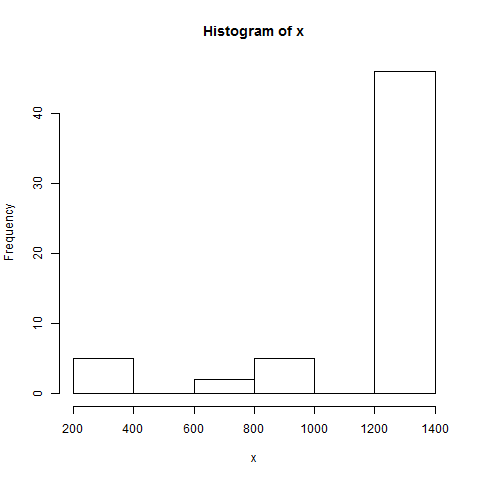
enter image description here

I would like to make a significance test on the paired differences between the two vectors, as well as measure association.

The process of data generation is "known" to generate log-normal data, when randomly sampled. In this particular experiment:

  1. samples are not random, there is a selection bias towards higher values
  2. sample range has been trucated at the top (in this plot, upper limit is 1250)

The issue in (1) is unavoidable. It is, in fact, the inclusion criteria for the experiment (the values are from a PRNT experiment, and patients were selected for giving positive results).

The issue in (2), however, means that true values beyond the imposed limit are unknown, and thus the over-representation of this max value in truth hides a richer diversity of values.

If neither of the above issues were present, odds would be decent of having a good linear relationship of the log-transformed data. Unfortunately no step of data colection can be repeated, and I must make whatever analysis possible.

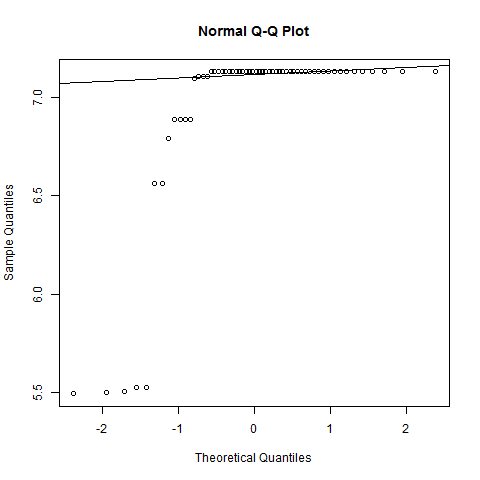
Using the usual log transformation on data doesn't help because of the issue (2) above. Parametric methods like t-test and pearson r are obviously out of question. I am inclined to use their non-parametric counterparts (paired wilcoxon and spearman correlation).

Is there any hope to find a transformation to mitigate the limitation in (2), and use parametric t-test/pearson r on this data?

QQ plot of the log transformed data

$\endgroup$
2
  • $\begingroup$ Are the values truncated, meaning if a true value is greater than 1250 it is never seen by the analyst, or censored, meaning if a true value is greater than 1250, the analyst only sees a 1250 (hopefully with an indicator that the true value is greater than 1250)? $\endgroup$
    – Cliff AB
    Commented Jun 7, 2017 at 19:42
  • $\begingroup$ It is censored, exactly what you wrote on both accounts (i.e., there is an indicator). $\endgroup$
    – philsf
    Commented Jun 7, 2017 at 19:59

1 Answer 1

2
$\begingroup$

If values above a given value are not directly observed, but rather we just know that they are above some other value, your data is censored. This is a topic that is covered extensively in the field of survival analysis. As such, most of the terminology used to describe censoring methods is in regard to event times, but many of the non-parametric methods easily extend to any type of data with censoring.

One of the most basic estimators used is the Kaplan-Meier estimator. This gives you a non-parametric estimate of the survival function (i.e. 1 - CDF). This can be very helpful for visually inspected the differences between two groups, for example. If you would like to do a test of significance between two groups, a very common method is the logrank statistics. If you'd like to use a regression model, the Cox-PH model is one of the most common.

If you are using R, all these methods are implemented in the survival package.

$\endgroup$
2
  • $\begingroup$ Thank you for your (+1) answer. Indeed I use R. If my google-fu serves me well, you are referring to survdiff? A follow up question: in this case, should I arbitrarily replace censored data encoded as >1250 by 1250, or should I arbitrate a higher value in order to separate these from observations near the range limit (e.g., 1240)? $\endgroup$
    – philsf
    Commented Jun 9, 2017 at 23:28
  • $\begingroup$ @philsf survdiff is the log rank statistic. survfit is the KM estimator. You need not impute the censored value, but rather each response is represented as a tuple; a value and an indicator for whether that this is exact true value, or whether it is censored at that value. This is constructed as a Surv object. See ?survdiff for an example. $\endgroup$
    – Cliff AB
    Commented Jun 9, 2017 at 23:34

Your Answer

By clicking “Post Your Answer”, you agree to our terms of service and acknowledge you have read our privacy policy.

Not the answer you're looking for? Browse other questions tagged or ask your own question.