I have trained two classifiers namely a logistic regression and a decision tree on a data set. When evaluating both models on the testing data set, the decision tree has a ROC AUC = 0.62 but the logistic regression has ROC AUC = 0.91. However both models have similar gain chart and the lift for the first decile is almost the same and is 5.7 and this is almost the highest lift I can get considering my response rate (~17%). How come that is possible and what it means?
2 Answers
While the interpretation of the AUC is something you should look up as it's widely available, in cases when you want a deeper analysis of your model, it is a wise choice to plot your ROC curve and not only calculate its area. It can give you insights on how your model is working (for example, your logistic regression model may have a sweet spot where it works well but the other thresholds perform horribly, which would bring the AUC down).
-
$\begingroup$ after drawing ROC, how to figure out what threshold perform horribly? The reason I'm asking is the threshold is not drawn in the ROC curve. $\endgroup$– HHHCommented Aug 10, 2017 at 22:38
-
$\begingroup$ A certain point performs better the closest it is to the upper left corner. As far as I know, there is no way of knowing the exact threshold point (there may be ways I'm not aware of, though), but it can guide you on which intervals to try. You could try and pinpoint a certain threshold interval and evaluate it manually. $\endgroup$ Commented Aug 10, 2017 at 22:42
-
1$\begingroup$ The selected answer in here might interest you: stats.stackexchange.com/questions/105501/… $\endgroup$ Commented Aug 10, 2017 at 22:43
-
$\begingroup$ what about the lift value? do you have any comment on the lift value here? $\endgroup$– HHHCommented Aug 10, 2017 at 22:44
-
1$\begingroup$ The fact that both have, probably, identified the group with the highest lift does not mean that they perform equally for the whole population. The decision tree may, for example, be incorrectly classifying a lot of the negative samples as positive, which would lower the AUC. $\endgroup$ Commented Aug 10, 2017 at 22:47
An alternative reason could be underfitting of the data. While it is quite unlikely to happen with decision trees, it could still be the case if some of the parameters were chosen poorly.
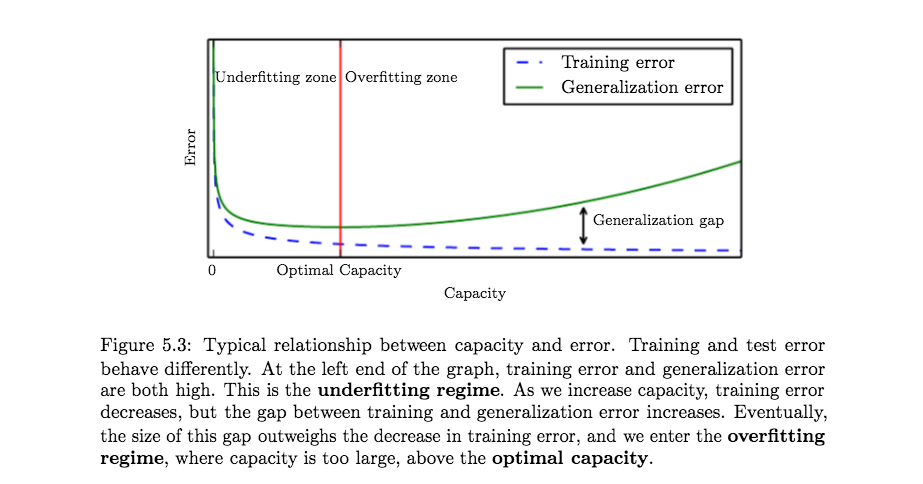
Underfitting is the exact opposite of overfitting: the capacity of your model is too low to fit the training data at all and your model under-performs. It generalizes very well and underperforms on the test data as well.
When people make statements such as "avoid overfitting", what they mean is actually to try to minimize the gap between the training and test error rates, sometimes referred as "generalization gap". There is a good explanation of this effect in (Goodfellow et al., 2016) see for instance figure 5.3.

If you get a poor fit on the training data you will of course get poor results on the test data too. Before drawing any conclusion about the performance of the test data, remember to always check the fit on the training data too.
References:
(Goodfellow et al., 2016) Ian Goodfellow, Yoshua Bengio and Aaron Courville. Deep Learning. MIT Press, 2016.
-
$\begingroup$ My main concern is about having a high 'lift value' while it's ROC_AUC is very bad. Besides, the AUC_ROC for training and testing in both models are very close (0.911 and 0.912 for logistic regression) and (0.621 and 0.622) for decision tree. the results looks a bit suspicious to me. Any idea? $\endgroup$– HHHCommented Aug 11, 2017 at 14:06
-
$\begingroup$ @H.Z. This all suggests massive underfitting - especially if the training ROC is no better than the test one. The high lift indicates that you have some special structure in your data that makes it respond well to this particular measure, but I'm afraid it is impossible to answer without actually seeing the data. $\endgroup$– CalimoCommented Aug 13, 2017 at 14:14
