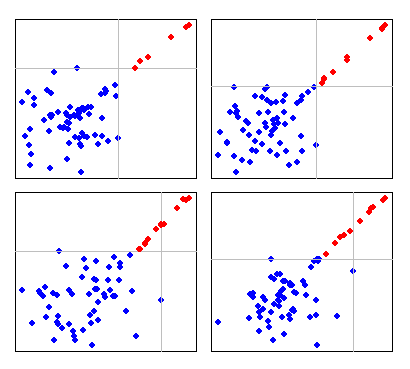
I have a dataset that contains bivariate data (x, y). Upon visual inspection, I can see that when the data are above certain threshold value (x_crit, y_crit), there is strong correlation between x and y. Below this value the two variables are largely not correlated. I have a large number of such datasets so visual inspection for each one of them is not possible.
So my question: is there any way to automatically determine this optimal cut off value of x_crit and y_crit?
I am thinking of plotting coefficient of correlation coefficient r of data where x > x_crit and y > y_crit against x_crit and y_crit (think r = f(x_crit, y_crit) and find the optimal x_crit and y_crit values giving best r. This is based on the assumption that when the critical values are too low, the uncorrelated observations will degrade the coefficient and when critical values are too high, correlation will also be corrupted by range truncation. But that sounds quite inefficient and I'm not sure whether that is going to work...
Any suggestions are welcome!
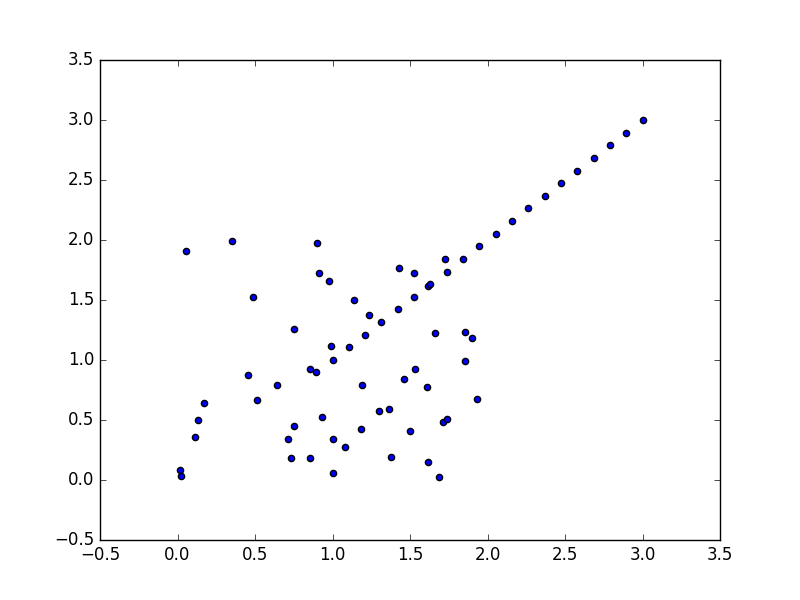
Update: There are requests for examples. I would like to post a toy example here:
You can see a big cluster of points under (2,2) that are completely unrelated to each other. However above 2,2 there is strong correlation. If try to do linear regression for all values, you will get r=0.62 only.
I want to detect the strong correlation above the threshold (x=2, y=2 for this example) out of the mess. Ideally the program should be able to identify x=2, y=2 as the threshold.


