1
$\begingroup$

I have a dataset that contains bivariate data (x, y). Upon visual inspection, I can see that when the data are above certain threshold value (x_crit, y_crit), there is strong correlation between x and y. Below this value the two variables are largely not correlated. I have a large number of such datasets so visual inspection for each one of them is not possible.

So my question: is there any way to automatically determine this optimal cut off value of x_crit and y_crit?

I am thinking of plotting coefficient of correlation coefficient r of data where x > x_crit and y > y_crit against x_crit and y_crit (think r = f(x_crit, y_crit) and find the optimal x_crit and y_crit values giving best r. This is based on the assumption that when the critical values are too low, the uncorrelated observations will degrade the coefficient and when critical values are too high, correlation will also be corrupted by range truncation. But that sounds quite inefficient and I'm not sure whether that is going to work...

Any suggestions are welcome!

Update: There are requests for examples. I would like to post a toy example here:

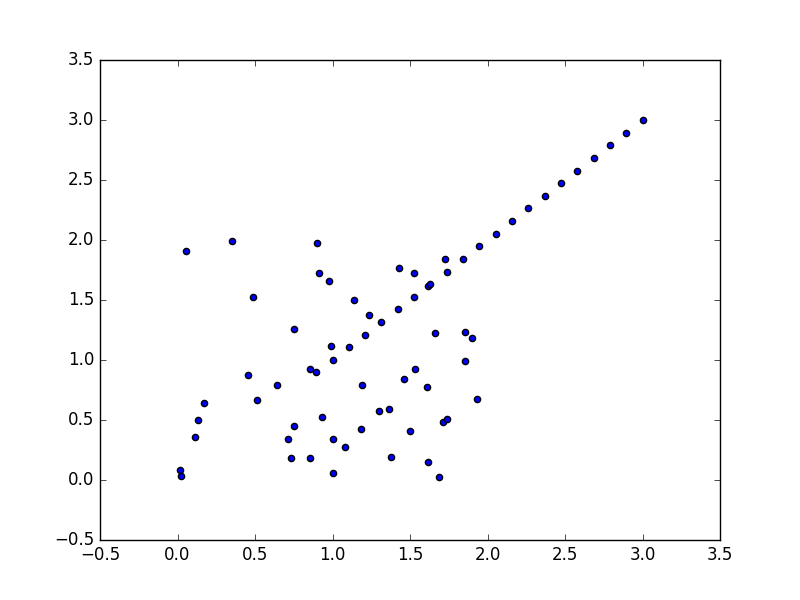
You can see a big cluster of points under (2,2) that are completely unrelated to each other. However above 2,2 there is strong correlation. If try to do linear regression for all values, you will get r=0.62 only.

I want to detect the strong correlation above the threshold (x=2, y=2 for this example) out of the mess. Ideally the program should be able to identify x=2, y=2 as the threshold.

enter image description here

$\endgroup$
10
  • 1
    $\begingroup$ Your question is interesting. Please post 1 example . $\endgroup$
    – IrishStat
    Commented Sep 15, 2017 at 15:46
  • 2
    $\begingroup$ The highest correlation coefficient will occur when there are just 2 points (r^2=1); you need to define the problem with some sort of penalty for including too few points otherwise each will devolve into this trivial case. $\endgroup$
    – tkmckenzie
    Commented Sep 15, 2017 at 15:56
  • $\begingroup$ @user177357 It depends on what you want to do with this bit of information called correlation. Are you going to fit a model? clustering your data? $\endgroup$
    – horaceT
    Commented Sep 15, 2017 at 17:44
  • $\begingroup$ @tkmckenzie Thanks for your comment. I have updated the question with an example. $\endgroup$
    – user177357
    Commented Sep 18, 2017 at 8:11
  • $\begingroup$ @horaceT Yes I was thinking of clustering as one approach, but unfortunately I am not too sure how to deal with this exactly... $\endgroup$
    – user177357
    Commented Sep 18, 2017 at 8:12

1 Answer 1

0
$\begingroup$

Suggested approach:

  1. choose a fraction of points with the largest x-values and fit a robust regression to them
    (You probably want a line that will go through the line when most are "on the line")
    - I used quantile regression; a Theil line might be better in some cases.
    - a number of other possible lines should also be fine

  2. find a rough idea of a "small" residual that should have a good chance to include all the good points (will require some tweaking of the criteria to suit your particular needs/data situation)

  3. identify the points with larger residuals
    - then find the largest x-value with a large residual and the largest y-value with a large residual

  4. mark as "good" the points that are larger than either


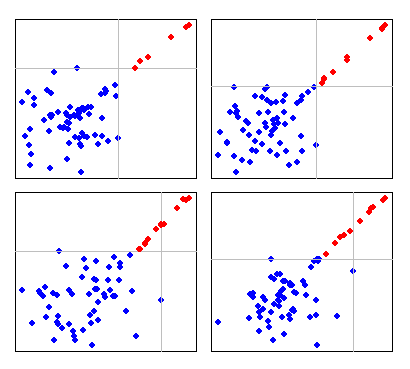
Four examples using the implementation below:

Four plots showing good points at the upper right identified separately from the big cloud at the lower left


An example coded in R (it would take little effort to turn this script into a function):

# make some sample data
z=runif(20,1,3);x=c(rnorm(50,1,.4),z);y=c(1.3*rnorm(50,1,.4)+1,1.3*z+1+rnorm(20,0,.04)) 

library(quantreg) # for L1 line (rq)
medabs.c=3     # Various constants to try to make it work for particular cases
tolr=1.e-5;tola=1.e-4
upperfrac = 0.2; trimfrac= 0.2
dfrac=0.1; rfrac=0.7

# choose a small fraction of the largest x-values & fit a robust regression 
# want a line that will go through the line when most are "on the line"
safeish=x>quantile(x,1-upfrac)
xu=x[safeish];yu=y[safeish]

# fit robust line to upper small fraction
 linf=rq(yu~xu)
 ab=linf$coefficients; a=ab[1]; b=ab[2] # extract coefs

# d are the residuals for *all* the data not just the subset
 d=y-a-b*x
 r=residuals(linf)  # the residuals in the subset

# find a rough idea of a "small" residual
m=mean(abs(r),trim=trimfrac)
smallish=m*medabs.c+tola+sd(r)*rfrac+sd(d)*dfrac # will probably need to adjust 
out=abs(d)>smallish  # which points have residuals that are "too big"

# find the largest x-value & y-value with a large residual
mx=max(x[out]); my=max(y[out])
plot(x,y,pch=16,col=4)
abline(v=mx+tola,h=my+tola,col=8)  # shift the lines a tiny amount so points look inside

# points that should be good
aboveor=x>mx|y>my
points(x[aboveor],y[aboveor],pch=16,col=2) #colour "good" points red
$\endgroup$

Your Answer

By clicking “Post Your Answer”, you agree to our terms of service and acknowledge you have read our privacy policy.

Not the answer you're looking for? Browse other questions tagged or ask your own question.