15
$\begingroup$

I am trying to find the local maxima for a probability density function (found using R's density method). I cannot do a simple "look around neighbors" method (where one looks around a point to see if it's a local maximum with respect to its neighbors) as there is a large volume of data. Furthermore, it seems more efficient and generic to use something like Spline interpolation and then find the roots of the 1st derivative, as opposed to building a "look around neighbors" with fault tolerance and other parameters.

So, my questions:

  1. Given a function from splinefun, what methods will find the local maxima?
  2. Is there an easy / standard way to find derivatives of a function returned using splinefun ?
  3. Is there a better/standard way to find the local maxima of a probability density function ?

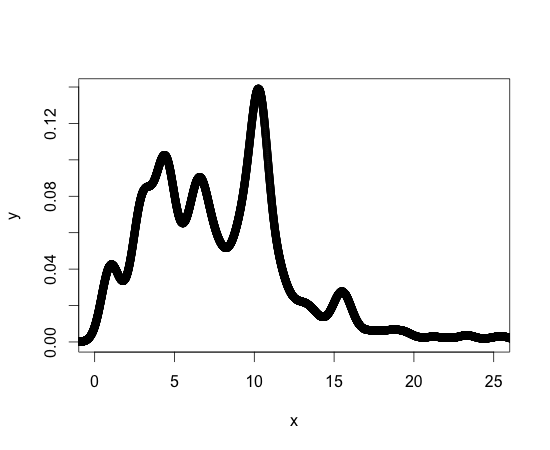
For reference, below is a plot of my density function. Other density functions I'm working with are similar in form. I should say that I am new to R, but not new to programming, so there may be a standard library or package for achieving what I need. density function
Thanks for your help!!

$\endgroup$
6
  • $\begingroup$ I'm not clear why the large volume of data is a problem for the 'look around neighbours' method. density() doesn't estimate the density for every datum, it estimates the density at n values, where n is a user-specified parameter with default value n = 512. $\endgroup$
    – onestop
    Commented Jun 19, 2012 at 15:39
  • $\begingroup$ My n for this is 2^15 and it seems that the data has a lot of variance at a point-by-point level. I tried writing a max/min finder using the something similar to the neighborhoods method (via msExtrema {msProcess}) and was only able to identify a few of the maximums, never all, by playing with the tolerance settings. $\endgroup$
    – aaronlevin
    Commented Jun 19, 2012 at 16:06
  • 2
    $\begingroup$ Looking at the code for msExtrema, it's a simple wrapper for peaks from the splus2R package, which you'd be better off using directly if you only want the local maxima and not the local minima. I can't see why using the default span=3 wouldn't find all the local maxima. And 2^15=32768 shouldn't be large enough for efficiency to be a big worry. $\endgroup$
    – onestop
    Commented Jun 19, 2012 at 16:37
  • $\begingroup$ The function returned by splinefun has an argument "deriv" that is 0 by default. Set deriv=1 for the first derivative. $\endgroup$
    – Cyan
    Commented Jun 19, 2012 at 16:44
  • 1
    $\begingroup$ Hmm, peaks appears to be buggy: It calls max.col with the default setting of ties.method = "random", which not only breaks ties at random but also sets a relative tolerance of 1e-5 for declaring a tie. The former is confusing, the latter is definitely not what you want here. peaks() also takes a strict parameter that is poorly documented and, looking at the function's code, does nothing. Ah, the joys of user-contributed software libraries! You might well be able to fix it though, as you say you're not new to programming, $\endgroup$
    – onestop
    Commented Jun 19, 2012 at 18:46

1 Answer 1

15
$\begingroup$

What you want to do is called peak detection in chemometrics. There are various methods you can use for that. I demonstrate only a very simple approach here.

require(graphics)
#some data
d <- density(faithful$eruptions, bw = "sj")

#make it a time series
ts_y<-ts(d$y)

#calculate turning points (extrema)
require(pastecs)
tp<-turnpoints(ts_y)
#plot
plot(d)
points(d$x[tp$tppos],d$y[tp$tppos],col="red")
$\endgroup$
2
  • $\begingroup$ Of all the solutions, this worked best. 1. Follow-up question: is there a way to toggle tolerance with turnpoints ? Found a lot of Peaks and Valleys in the long-tail portion of the Density function. 2. Follow-up question #2: what is a good way to determine tolerance? $\endgroup$
    – aaronlevin
    Commented Jun 20, 2012 at 14:06
  • $\begingroup$ ad 1. I don't think so. It is intended for testing randomness of time series, so the function doesn't need that. You could try to test relevance/significance of a peak yourself. E.g., you could do a t-test against the neighborhood (where you can decide how big the neighborhood should be). Or you can look for a more sofisticated function in R packages for evaluation of data from (mass) spectrometry or other analytic chemistry methods. $\endgroup$
    – Roland
    Commented Jun 20, 2012 at 14:26

Your Answer

By clicking “Post Your Answer”, you agree to our terms of service and acknowledge you have read our privacy policy.

Not the answer you're looking for? Browse other questions tagged or ask your own question.