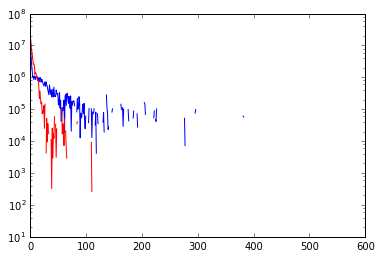
I have two datasets plotted on two axis like this:
The datasets can be interpreted as a series of counts. The x and y arrays that form the blue line, for example look like
x = [0, 1, 2, ...]
y = [20788583, 4731125, 2534681 ...]
The interpretation is that there are 20.8 million counts at index 0; 4.7 million counts at index 1, etc.
This graph is messy, and I had the bright idea to use a gaussian KDE to smooth out this graph to better display my data. However, I'm struggling with implementing a kernel smoothing in python.
I am attempting to use scipy.stats.gaussian_kde() to smooth the data. But that function seems like it should take a univariate array where each instance of the index is entered separately. For example, my input array is to that function should look like
x_kde = np.concatenate([[i] * y[i] for i in range(len(y))])
Which will look like:
x_kde = [0, 0, 0, ...(20 million more)..., 0, 1, 1, ...(4.7 million)...]
However, as you may have noticed from the counts, this is a very long list, with a length over 100 million. In fact, that list is crushing the memory on my laptop.
The list I have is simply a compressed version of the list that I need to feed into gaussian_kde(), so surely there must be some way to use it as is.
How can I take a python array where the value represents the number of counts at that index and perform a KDE smoothing on it in python?

