Here are some of my understandings about OLS regressions:
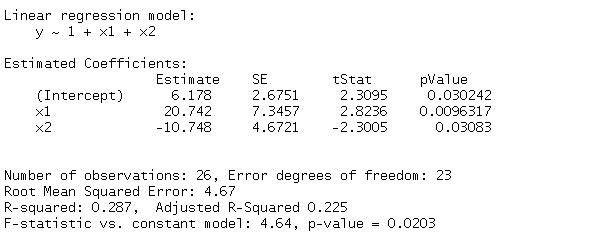
(1) R squared is not a p-value but rather a statistic computed from sample, so you don't interpret it as the p-value of the regression. In your regression output the F-test turns out to be significant at 5%, which is a pretty good evidence that your R squared is not that close to be insignificant. (A bit more detail, this F-test is very closely linked to R squared. See this post Whats the relationship between $R^2$ and F-Test?)
R squared of 20%-ish is not bad in a cross-sectional or panel study, but pretty awful in a time series analysis. This is because the cross-sectional data are much more heterogeneous and the idiosyncratic variations within the data (or SSR if you prefer) dominates the total variations within the data, which leads to a low R squared.
However, we are still happy to accept this subjectively lower R squared because the point is not to explain the variation of the data perfectly, but rather looking for common factors that have a similar effect on most of the entities in the dataset.
In your case, the F-test is significant at 5% level, which suggests that this model performs significantly better than a model with only constant. This is evidence to support that the independent variables do to some extent explain the variations of the dependent variable, so that the R squared is not zero.
(2) One advantage of the regression model is that it allows you to quantify the effect of each individual factor by also considering the interactions between the factors. In a regression you are able to interpret the results as marginal effects. For example, 1 unit increase in X1 is on average associated with 20.7 units increase in Y, ceteris paribus.
The motivation of using correlation is probably because of its simplicity. As a crude measure of how a pair of variables co-move with each other linearly, it usually does the job. However it fails to take the interactions between variables into consideration, and you don't have the nice marginal effect interpretation.
Also, R squared is the square of the correlation of the dependent variable and the fitted value of the regression.

