0
$\begingroup$

enter image description here

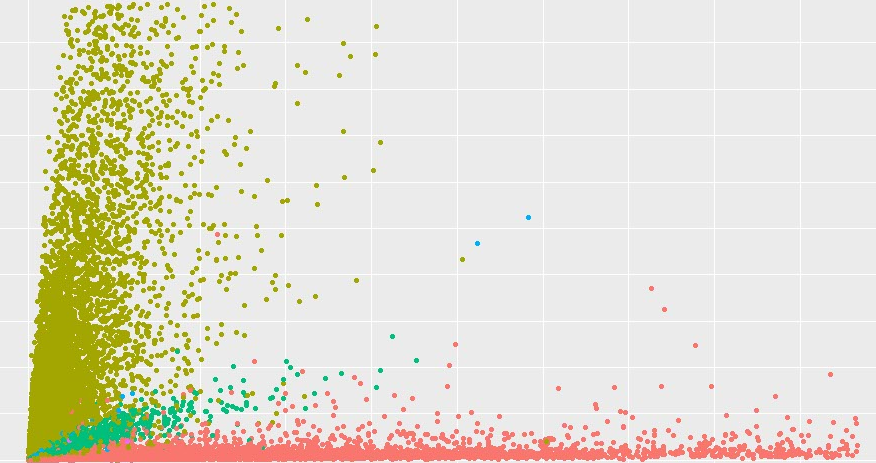
what I wanna do is extract some information from this graph. little bit about this data is the x is the amount of stuffs that ppl buy and y is how much they pay. and the colors show the different genre of stuff.

I thought use k-means to cluster theses data by genre using x and y but I'm not sure. Multiple regression might work as well but first I need you guys to tell your thoughts.

pls tell me any ideas about this graph

$\endgroup$
1
  • $\begingroup$ Are you literally asking about scraping this image for information or are you asking about how to analyze the data represented by the image? $\endgroup$
    – whuber
    Commented Jan 20, 2018 at 14:16

1 Answer 1

0
$\begingroup$

Depends on what you want to do.

  1. Regression: predict average price or amount given that you know the kind and the other value.
  2. Classification: given the price and amount, predict the type.
  3. Clustering: forget that you already know the kind, and try to rediscover it.

Clearly, as you already have the colors, 3 does not make much sense. But I doubt that either 1 or 2 is particularly interesting on this data either. Looks very much fake data anyway. But you'd need many more attributes to find any interesting learning task beyond computing the average price/quantity for each genre.

$\endgroup$

Your Answer

By clicking “Post Your Answer”, you agree to our terms of service and acknowledge you have read our privacy policy.