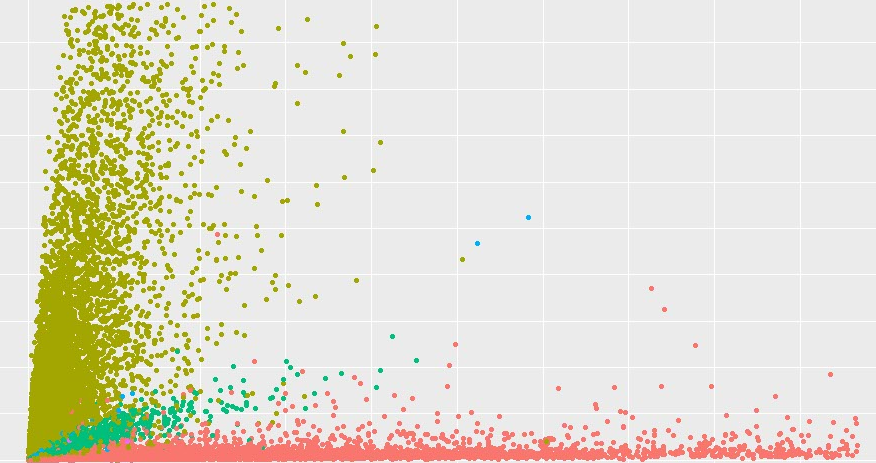
what I wanna do is extract some information from this graph. little bit about this data is the x is the amount of stuffs that ppl buy and y is how much they pay. and the colors show the different genre of stuff.
I thought use k-means to cluster theses data by genre using x and y but I'm not sure. Multiple regression might work as well but first I need you guys to tell your thoughts.
pls tell me any ideas about this graph

