2
$\begingroup$

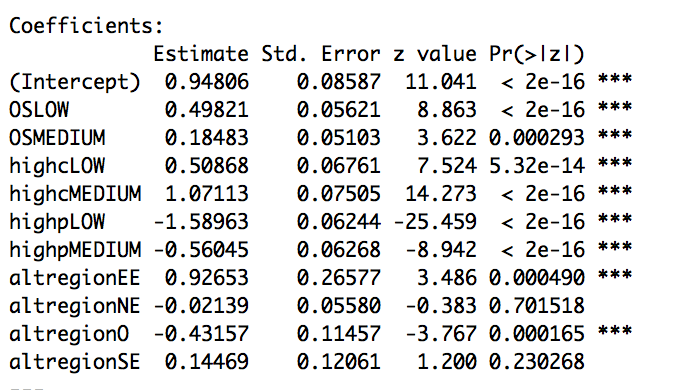
I get the following coefficients from a logistic glm but need to convert it into a formula, i.e. Y= b0 + bx1 + bx2...

enter image description here

My challenge is that the variables are discrete and each missing a category: OSHIGH, highcHIGH, highpHIGH, altregionDK. How do I get the coefficients for these variables or create a formula including all?

$\endgroup$
2
  • $\begingroup$ I think indicator variables can be used. $\endgroup$
    – Shanks
    Commented May 20, 2018 at 13:47
  • $\begingroup$ The equatiomatic package should make this easy. $\endgroup$ Commented Sep 3 at 13:52

3 Answers 3

1
$\begingroup$

Your problem is that R is using one level of each categorical predictor as a reference level. You can actually derive your values from your current output, but I believe you can also get explicit output by forcing regression through the origin with formula = Y ~ X1 - 1 (of course adapt this to fit your use case).

$\endgroup$
1
  • 1
    $\begingroup$ This solution works when there's only one categorical variable. The most reliable, explicit solution is to review the model matrix that R uses, which can be found by calling stats::model.matrix. $\endgroup$
    – whuber
    Commented Sep 3 at 15:06
1
$\begingroup$

Your formula would be

y = inv_logit(.9 + .5 * (OS = low) + .2 * (OS = medium) + ...)

when OS is high your prediction would be inv_logit(.9 + ...) where all others can be set to 0 or their mean.

In a Bayesian model (or neural network) you could have effects/coefficients for all three OS levels.

$\endgroup$
0
$\begingroup$

In order to model effects for categorical factors in a regression model, you have to contrast code your factors. The degrees of freedom for your categorical factor will always be k - 1, where k is the number of levels in the factor which is why you see only 1 coefficient for a 2-level categorical factor.

Dummy coding is the factory default in R and presumably what you are using here if you didn’t change anything and it compares group B, C, D etc to group A, where group A is the reference group to which all other levels of the factor are compared.

TL;DR: nothing is wrong here or missing, this is as to be expected. To read more about contrast coding, you can read here at this excellent resource: https://stats.oarc.ucla.edu/r/library/r-library-contrast-coding-systems-for-categorical-variables/

If you want to 'recover' the estimates for each group, there are a variety of options. I think this function from emmeans package should work:

emm1 = emmeans(fit1, specs = pairwise ~ OS)

You could also do the following function from ggeffects package:

ggpredict(fit1, c("OS"))

For more reading on marginal effects, this excellent digital textbook is available: https://marginaleffects.com/vignettes/predictions.html

$\endgroup$

Your Answer

By clicking “Post Your Answer”, you agree to our terms of service and acknowledge you have read our privacy policy.

Not the answer you're looking for? Browse other questions tagged or ask your own question.