2
$\begingroup$

I have (censored) survival data that I am fitting with a proportional hazards model with a continuous covariate, X (for my purposes, X ranges from 0 to 1). After fitting the model, I get a statistically significant relationship between X and survival. The problem is, how do I actually illustrate this relationship?

An important point here is that I want to illustrate not merely that survival time is associated with x (if it were just that, I could divide the data into two groups - one with x > some cutoff and another <= the cutoff); I want to illustrate that the relationship is a continuous one: that the larger x gets, the worse survival gets (or the opposite), across the whole range of x. So just arbitrarily dividing the data up into several groups isn't ideal.

Here's some example data (and the Cox model) in R:

set.seed(1234)
x <- runif(1000,0,1)
NumericStatus <- sample(c(0,1),length(x),replace=TRUE)
medianSurvMin <- 5
medianSurvMax <- 50
median.surv <- medMin + x*(medMax-medMin)
rates <- 1/median.surv
surv.time <- rexp(length(x), rate=rates)
library(survival)
cph <- coxph(Surv(surv.time,NumericStatus)~x)
summary(cph)$coefficients

Here, I get a coefficient on x of about .17 and a p-value of basically 0. Now, without censoring (if we set all values in 'NumericStatus' to 1), just plotting survival times against x well illustrates the association is continuous (or, alternatively, discrete). But with censoring I can't really do this. A major issue here is that, with the Cox proportional hazards model, we assume that we don't know what the baseline hazard is, but it still contributes to the data, which makes inherently problematic to try to illustrate the data along with the imputed proportional hazards model. It's hard to plot data along with the model you're fitting it to when you start from the assumption that you can't know the full model.

Is there any plot or table I could make to illustrate the continuous relationship between x and survival time? References to academic literature are welcome; I did a cursory search and didn't find what I was looking for.

$\endgroup$
1
  • $\begingroup$ Do you specifically need survival time? Are you restricted to the Cox model? $\endgroup$
    – Todd D
    Commented Jul 4, 2018 at 21:45

2 Answers 2

1
$\begingroup$

It is actually a very frequent problem in survival analysis. I have recently published a preprint on this topic, which can be found here: https://arxiv.org/abs/2208.04644. All plots that I am proposing in this preprint are included in the associated R-package contsurvplot, available on github: https://github.com/RobinDenz1/contsurvplot

Let's return to your example. First we create the data and fit the model:

library(survival)

# create the data
set.seed(1234)
x <- runif(1000,0,1)
NumericStatus <- sample(c(0,1),length(x),replace=TRUE)
medMin <- 5
medMax <- 50
median.surv <- medMin + x*(medMax-medMin)
rates <- 1/median.surv
surv.time <- rexp(length(x), rate=rates)
data <- data.frame(time=surv.time, status=NumericStatus, x=x)

# fit the cox model
cph <- coxph(Surv(time, status) ~ x, data=data, x=TRUE)

Now we install the contsurvplot package:

devtools::install_github("RobinDenz1/contsurvplot")

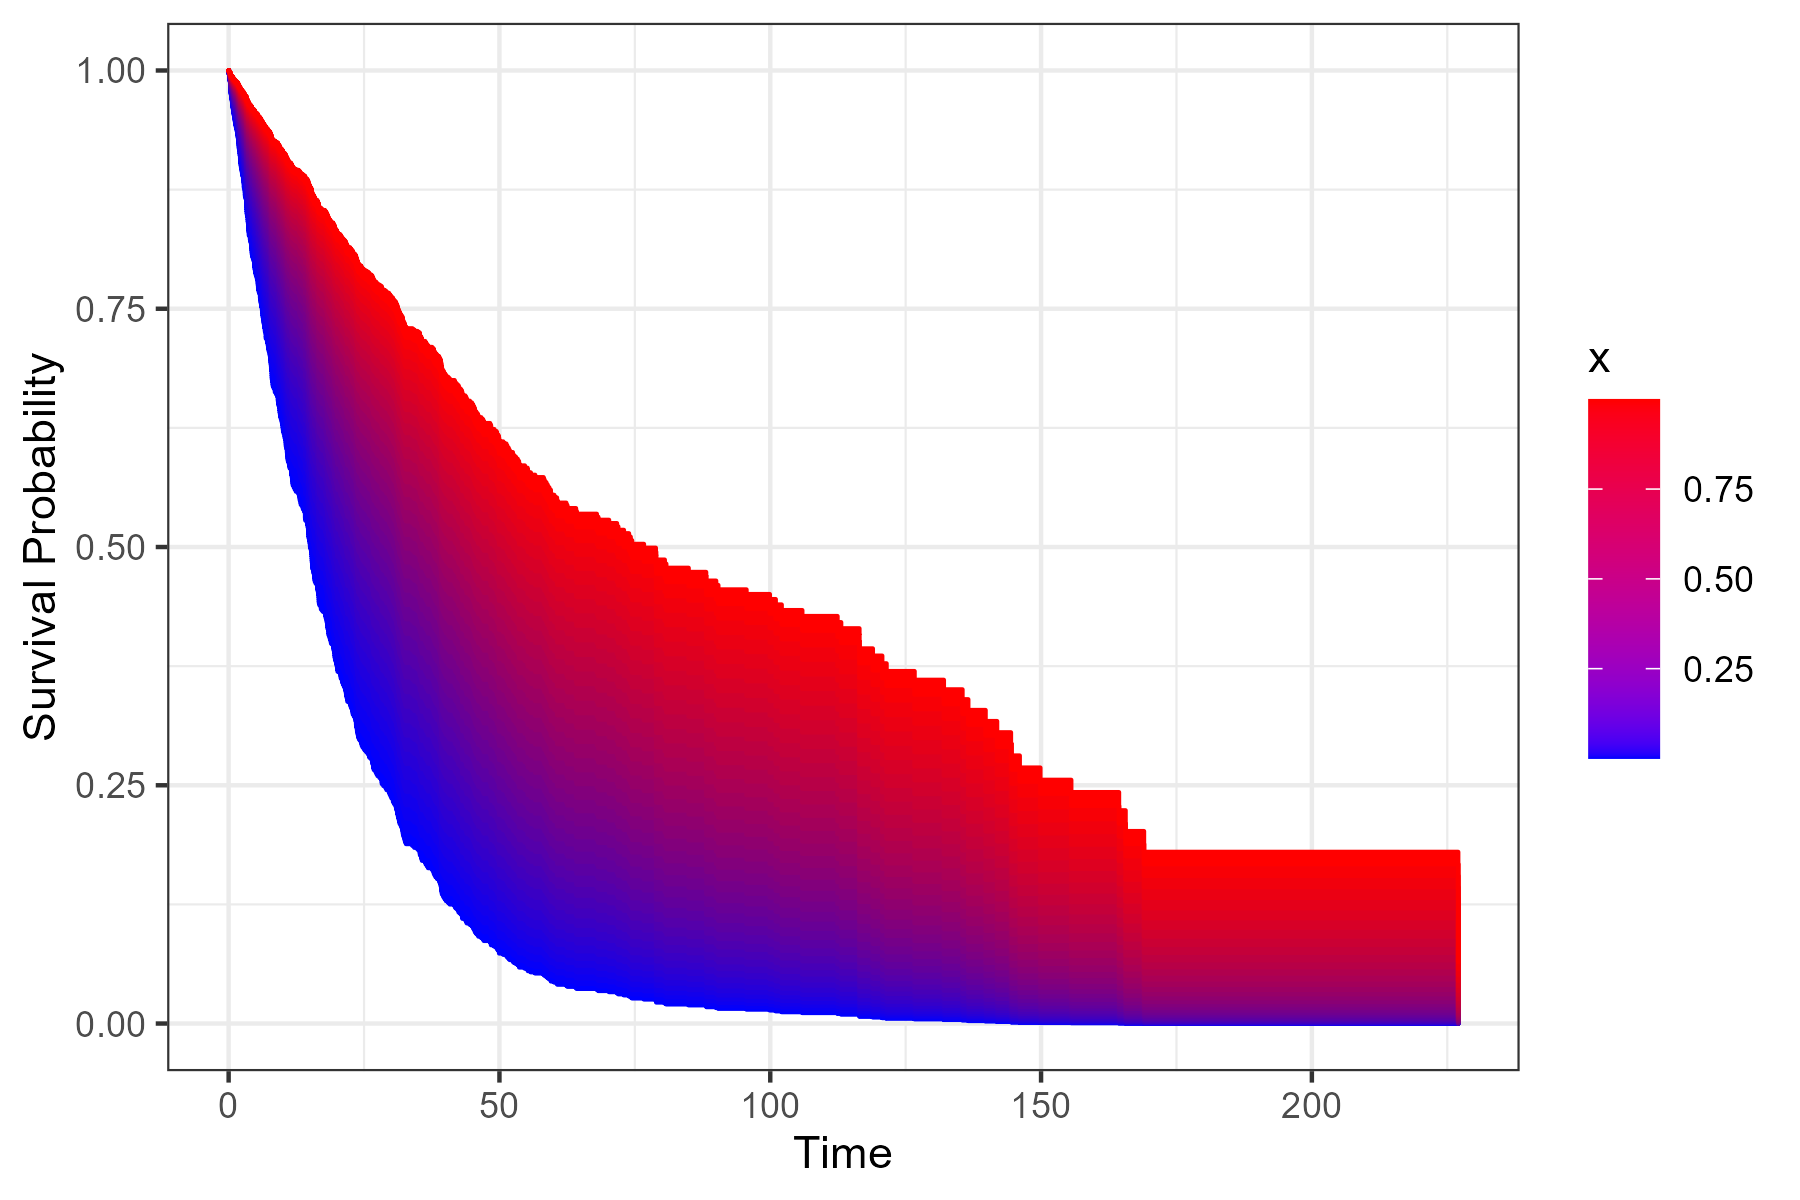
Now we can use the following code to get a survival area plot:

library(contsurvplot)
library(riskRegression)
library(ggplot2)
library(pammtools)

plot_surv_area(time="time",
               status="status",
               variable="x",
               data=data,
               model=cph)

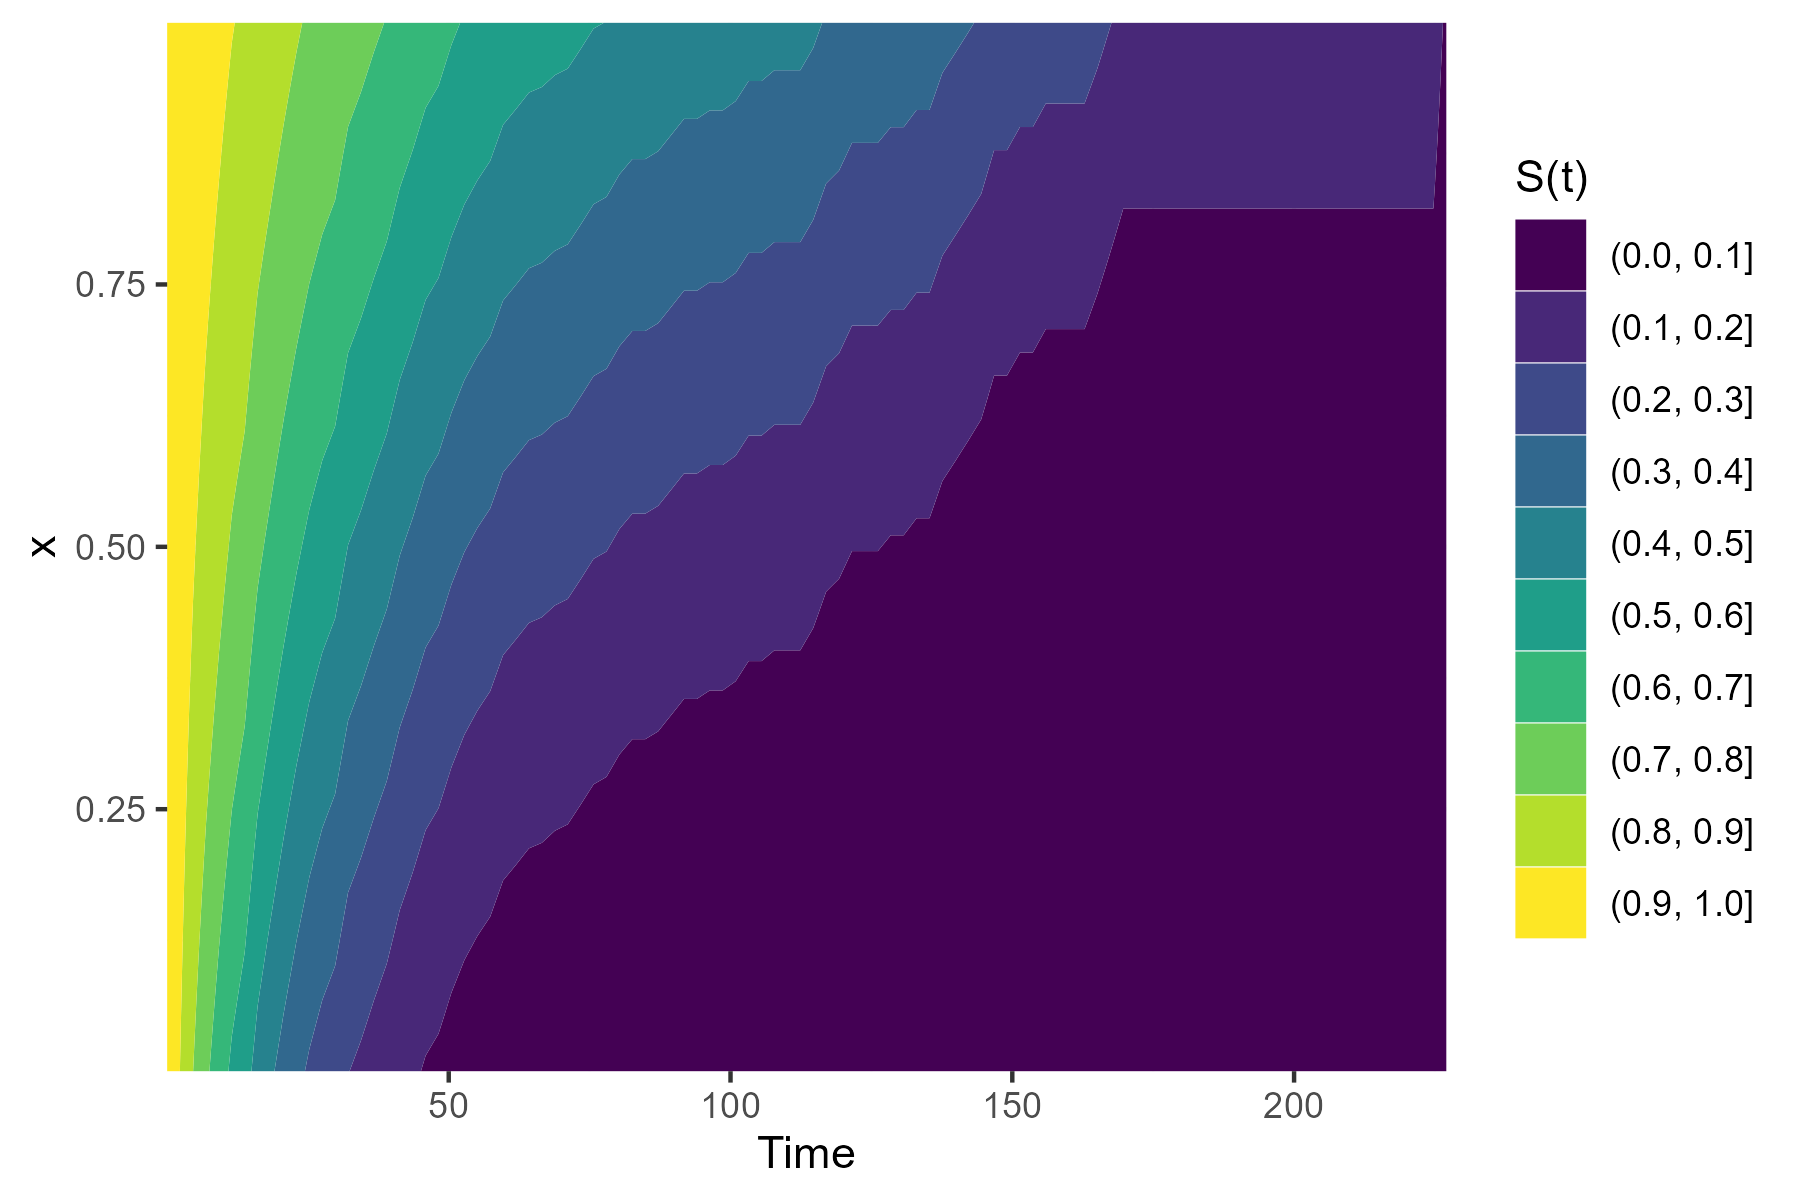
surv_area Alternatively, we could create survival contour plot:

plot_surv_contour(time="time",
                  status="status",
                  variable="x",
                  data=data,
                  model=cph)

surv_contour I personally think that both of these plots are better than artifical categorization of the continuous covariate and using simple Kaplan-Meier plots.

$\endgroup$
0
$\begingroup$

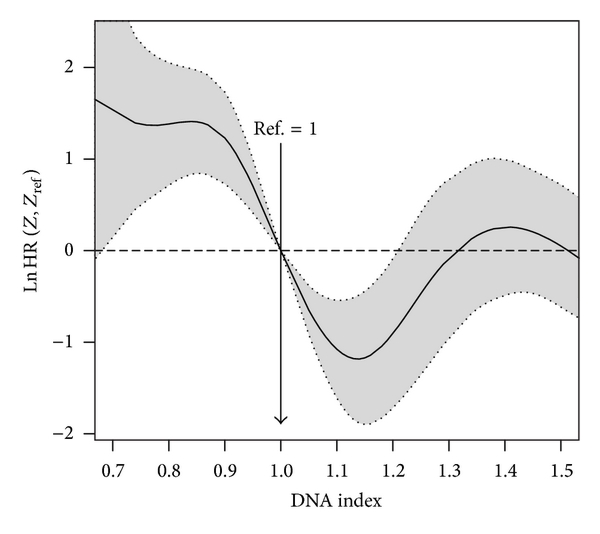
I'm dealing with exactly the same issue. I tried the SmoothHR package in R, but this is more a prediction approach. It yield a hazard ratio for every value of a continuous variable but does not provide an optimal cut off point. example output of smoothHR

$\endgroup$

Your Answer

By clicking “Post Your Answer”, you agree to our terms of service and acknowledge you have read our privacy policy.

Not the answer you're looking for? Browse other questions tagged or ask your own question.