Consider the following (partial) regression results, in which the explainatory value of 5 independent variables are measured for 3 dependent variables. In this post, I'm referring to the models (1d), (2d) and (3d). For each model, the first column is the coefficient, the second the p-value:

In my thesis, I defined several hypotheses, a.o.
- if
hvVol0LNincreases,trading volumeincreases - if
hbVol0LNincreases,returnsincrease - if
hbAgreeQ0decreases,returnsincrease - if
svi0increases,trading volumeincreases
It is now time to check whether these assumptions were right. I just want to double check whether I'm interpreting these results right:
- hypothesis accepted: there is a relatively strong (
r=.146) and statistically significant (p=.000) relationship - hypothesis rejected; the relationship is very small to begin with, but what is more it is statistically insignificant (
p=.142). It would only be significant at the 14,2% significance level - hypothesis accepted at 5% level: the relationship between
hbAgreeQ0andreturnsis indeed negative and relatively strong (r=-.100), and statistically significant at the 5% level (p=.005). Ifpwould have been larger than.005, the relationship would not be statistically significant, since in practive significance levels of 1% to 5% are accepted (depending on the type of research, of course) - hypothesis accepted: the relationship is significant (
p=.000) but not very strong ('r=.052')
Is this a correct way of describing the outcome of the hpyotheses? In other words:
- can you derive the acceptance / rejection directly from the regression output, and
- am I interpreting the
randp-values correctly?
Your help in finally finishing my thesis is greatly appreciated :-)
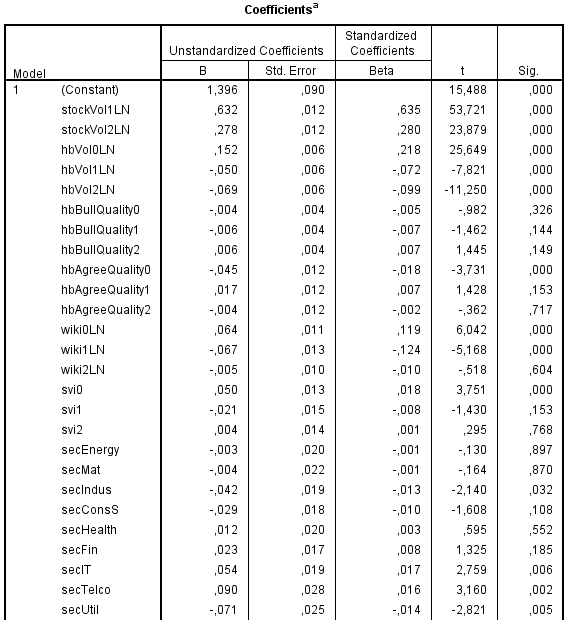
edit: some SPSS regression output to be more clear of what I mean by r

