I have been playing with the Kaggle House Prices dataset for sometime. I have been using only the non-categorical features.
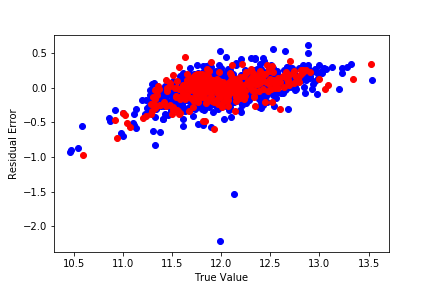
After fitting LASSO I plotted the residual error vs true value scatter plot. Blue points are from training set and red points are from validation set.
As expected there are some outliers with high residual error. Most of the residuals are clustered around zero. I think it is expected that the mean value of residual errors should be zero.
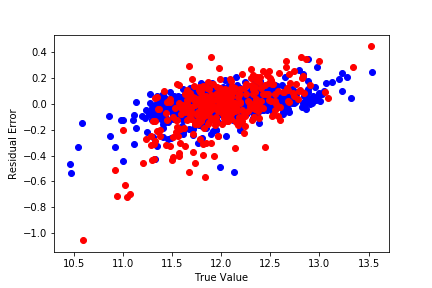
But the more interesting question is how does the mean residual error change across the whole range of output. In this case the residuals tend to be positive when outputs are high and residuals tend to be negative when outputs are low. There seems to be a linear relationship. This relationship is present in both the train set and validation set. Apart from LASSO I also tried Ridge and OLS with similar results.
I also tried a random forest model. The result is almost same. There is more overfitting but the general trend is there. Even random forest fails to capture this trend.
So my question is why cannot neither a linear nor a non-linear model learn this linear relationship?


