6
$\begingroup$

I did the multiple linear regression on a dataset of 412 observations, with one response variable (Y) and 25 explanatory variables(X1-X25). Y and most of Xs are not normally distributed. Besides, there are some correlation between several Xs. The plot show that the residuals strongly correlated with Y positively and weakly correlated with fitted Y negatively.(Sorry.As I'm newer in this website, I am n't allowed to post images.)

To address these problems, I have tried the principle component regression, the weighted least squared regression and the ridge regression. They all didn't work. I want to know what's wrong with the regression. Why did the residuals correlate with observed Y so obvious?

$\endgroup$
5
  • $\begingroup$ In linear models, the explanatory variables are usually assumed to be non-random, so talking about their distribution (or, indeed, correlations) is meaningless. Are you sure that multiple linear regression is a good choice here? That being said, the residuals can be heavily correlated with $Y$ (or $X$) if, for instance, you have non-independent errors or non-linear relationships. $\endgroup$
    – MånsT
    Commented Apr 18, 2012 at 8:43
  • $\begingroup$ Related, What is the expected correlation between residual and the criterion variable? $\endgroup$
    – Andy W
    Commented Apr 18, 2012 at 21:23
  • $\begingroup$ Dear Andy, I have thought that the residual should be randomly distributed along the Y. If it correlated with Y, there must be some problems. $\endgroup$
    – friendpine
    Commented Apr 19, 2012 at 2:17
  • $\begingroup$ Can you provide with several other methods for my data?In my data, Y and most Xs are numeric variables and the other Xs are binary variables. Because there are 25 Xs, it is very difficult to formulate the suitable relationship between Y and Xs. Do you have any suggestions? Thanks in advance! $\endgroup$
    – friendpine
    Commented Apr 19, 2012 at 2:21
  • 1
    $\begingroup$ Of course the residuals correlate positively with $Y$! That's because the residuals $R$ are uncorrelated with the predicted values $\hat Y$ and, by definition, $Y = \hat Y + R$. Thus you are looking at the relationship between data $R$ and the same data as modified by uncorrelated "noise" $\hat Y$. $\endgroup$
    – whuber
    Commented Feb 14, 2017 at 18:33

2 Answers 2

15
$\begingroup$

1) Residuals do correlate positively with observed values in many, many cases. Think of it this way - a very large positive error ("error" is the "true residual", to misuse the language) means that the corresponding observation is, all other things equal, likely to be very large in a positive direction. A very large negative error means that the corresponding observation is likely to be very large in a negative direction. If the $R^2$ of the regression is not large, then the variability of the errors will be the dominating effect on the variability of the target variable, and you will see this effect in your plots and correlations.

For example, consider the model $y_i = a + x_i + e_i$, which we'll model as $y_i = a + bx_i + e_i$, (which is correct for $b = 1$.) Here's the result of a regression with 100 observations:

e <- rnorm(100)
x <- rnorm(100)
y <- 1 + x + e

foo <- lm(y~x)
plot(residuals(foo)~y, xlab="y", ylab="Residuals")

> summary(foo)

Call:
lm(formula = y ~ x)

Residuals:
    Min      1Q  Median      3Q     Max 
-3.3292 -0.8280 -0.0448  0.8213  2.9450 

Coefficients:
            Estimate Std. Error t value Pr(>|t|)    
(Intercept)   0.8498     0.1288   6.600 2.12e-09 ***
x             0.8929     0.1316   6.787 8.81e-10 ***
---
Signif. codes:  0 ‘***’ 0.001 ‘**’ 0.01 ‘*’ 0.05 ‘.’ 0.1 ‘ ’ 1 

Residual standard error: 1.286 on 98 degrees of freedom
Multiple R-squared: 0.3197, Adjusted R-squared: 0.3128 
F-statistic: 46.06 on 1 and 98 DF,  p-value: 8.813e-10 
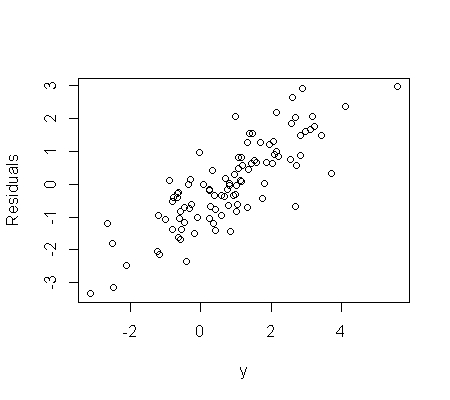
enter image description here

Note that we achieved a fairly respectable (in some fields) $R^2$ of 0.32.

We can obscure this effect with a different model:

y <- 1 + 5*x + e

foo <- lm(y~x)
plot(residuals(foo)~y, xlab="y", ylab="Residuals")

which has an $R^2$ of 0.93 and the following residual plot:
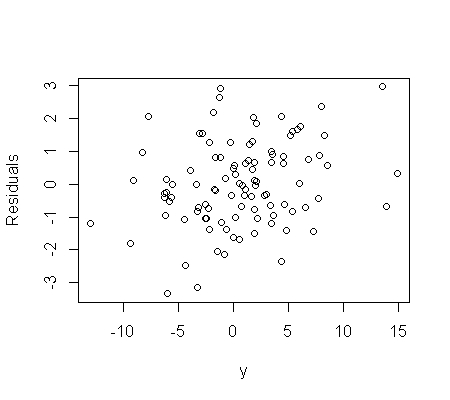
enter image description here

Here the correlation between $y$ and the residuals is about 0.25, but it's a lot less obvious on the plot.

2) Residuals have correlation zero with fitted values in a linear regression, by construction. Is your statement "... weakly correlated with fitted Y negatively" based solely upon looking at the plot, or did you actually calculate the correlation? If the former, appearances can be deceiving... if the latter, something is wrong; possibly you aren't looking at what you think you're looking at.

$\endgroup$
4
  • $\begingroup$ Dear Jbowman, thanks for your explanation! But the question still bother me. Why did the residual correlate with the response variable? Is this because the Xs can't explain the response variable well? If this, did it mean that the variance increase as the Y increase? My analysis showed that the variance of Y didn't increase with Y. Can you explain more about this question? Thanks! $\endgroup$
    – friendpine
    Commented Apr 19, 2012 at 2:14
  • 2
    $\begingroup$ If you look at my second example, $X$ explains the response variable very well, with an $R^2 = 0.93$, but there's still correlation. The correlation also has nothing to do with heteroskedasticity. The key is that the response variable = the estimated regression function + the residual, so it makes sense that the response variable would be positively correlated with the residual, since it's made up in part by it. $\endgroup$
    – jbowman
    Commented Apr 19, 2012 at 14:40
  • $\begingroup$ Is the key point that we need to check the residuals~fitted and not the residuals~y? $\endgroup$
    – kl-higgins
    Commented Feb 23 at 17:49
  • 1
    $\begingroup$ @user3386170 - yes, that would be a good takeaway. $\endgroup$
    – jbowman
    Commented Feb 24 at 0:03
3
$\begingroup$

residuals almost always correlate with your observations as long es your regressors do not fully explain the true underlying data model. So the presence of high correlation between $y$ and residuals is evidence for the presence of noise/variation that is not captured by your explanatory variables.

This could have several reasons

  1. Your regressors are only weakly related to your target variable
  2. Even if they are strongly correlated, your observation might be very noisy or the amount of noise in the system is high.
  3. Your regression model is not well specified, i.e., non-linearity, non-gaussianity in the error terms.
  4. You have too few data points to efficiently identify the right relationships.

Since you will most likely not be able to increase your data sample size as it is an outside restriction, try to normalize your regressors and target variable so that they resemble more normally distributed variables (log transforms for positive variable for instance). In this case, OLS regression models can be more efficient in identifying the true underlying relationships.

Correlation among regressors should not affect the in-sample residual correlation too much (only your parameter estimates will be skewed).

$\endgroup$

Your Answer

By clicking “Post Your Answer”, you agree to our terms of service and acknowledge you have read our privacy policy.

Not the answer you're looking for? Browse other questions tagged or ask your own question.