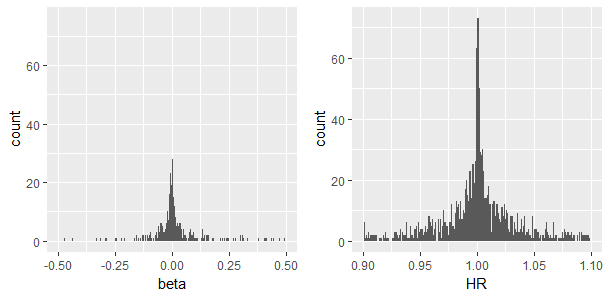
I'm analyzing TCGA data to investigate the effects of lncRNAs on survival. Among other things, I wanted to calculate a univariate CoxPH model for each gene to find genes whose expression levels have a significant correlation with survival outcome. I realize that I'm not testing the CoxPH assumptions for each gene, but I'm not sure if it has a lot to do with my question here.
I have two main questions:
1: Out of ~12000 lncRNA genes found in my dataset, around ~1600 was found to be significantly associated with survival outcome (p<0.05). However, the majority of these genes have very low beta coefficients and concomitantly HR values very close to 1 (see below a histogram of beta and HR values). HR values close to 1 indicates no big effect on the clinical outcome.
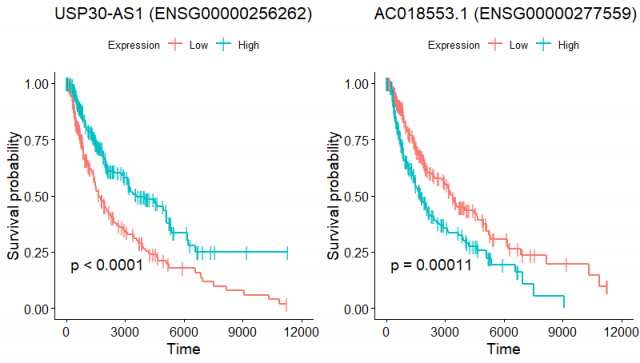
I was curious to see if these genes really have a dismal effect on survival by plotting KM curves. Here I'm showing two example genes that were selected due to their low p-values in CoxPH model with the following details:
Gene_______Beta___HR____Wald___p.value
USP30-AS1 -0.0056929 0.99432 18.66 1.558e-05
AC018553.1 0.0033293 1.00330 28.54 9.192e-08
I categorized the expression as high and low at the median expression value in all the patients. Here are the KM curves:
To me, it is a bit weird to have genes whose high vs low expression correlates with a very clear separation in the survival curves, while coxPH model predicts a tiny effect on the survival outcome. Can somebody explain what I'm missing here?
2: Few genes (with p<0.05) had extreme HR values (>200 and in one case 12360!). Upon closer inspection, I noticed that these genes are only expressed in 1-5 patients in the cohort of 457 total patients. I wouldn't have thought that CoxPH model would find rare genes like this significant (even though potentially the expression of these genes can correlate with poor clinical outcome in all of these 1-5 patients). Can somebody enlighten me about why these genes are produced at the end of CoxPH as significant 'hits'?
Thank you very much
Atakan


