Hello (and thanks for reading this).
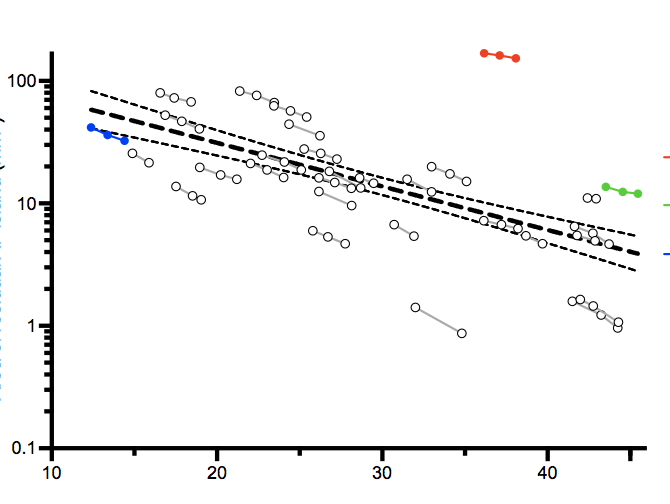
I have a set of data that looks at the area of remaining retina against age. I have three points of data per patient. We know that over time, the area of remaining retina decreases exponentially. I have done a linear regression to model loss of area over time (see graph). X axis = age, Y axis = retinal area (log scale).
In this data there are some patients that are outliers because of their genetic mutation. I am interested in doing a formal test to see whether because of this mutation, they have a significantly larger area of retina remaining for their age, compared to the rest of the cohort. I have read about various tests (Grubbs, Dixon etc) but they don't seem to apply here for bivariate data. I am aware that I can identify outliers by visualising them, but I want a formal test with a p value if possible to satisfy reviewers who have requested it.
Please see the attached graph to demonstrate what the data looks like. The red and green dots are the patients I am interested in testing. Any suggestions on how to analyse this would be most appreciated. I am using Prism 7 for analysis. I can't seem to find an answer for this question on stack anywhere. As you can probably tell, my stats experience is fairly limited. Thanks for your help.

