I have a dataset of a discrete random variable. My question is: Is the normed histogram(I divide the frequencies by the total number of samples) and the PMF is the same quantity? It seems they are. Is this correct or there is something that I am missing?
-
7$\begingroup$ Probability mass function is the underlying distribution that dictates the data generating process. Your normalized histogram is an empirical estimate of that distribution. $\endgroup$– Moss MurdererCommented Nov 5, 2018 at 22:05
-
2$\begingroup$ I wouldn't object to some term like "empirical probability mass function". After all, it's common to see "empirical cumulative distribution function". But I agree that without qualification "probability mass function" would be expected to refer to the theoretical beast. $\endgroup$– Nick CoxCommented Nov 6, 2018 at 10:18
1 Answer
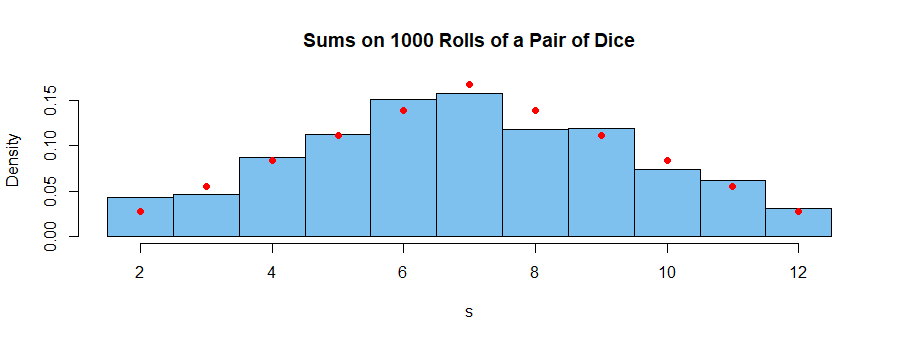
As a simple example, suppose you roll a pair of fair dice 1000 times. Then you might get the data simulated below for the 1000 sums. (Simulation using R statistical software.)
set.seed(1105);  die = 1:6;  n = 1000
s = replicate( n,  sum(sample(die,2,rep=T)) )
table(s)
s
  2   3   4   5   6   7   8   9  10  11  12
 43  46  87 112 151 157 118 119  74  62  31

 hist(s, prob=T, br=(1:12)+.5, ylim=c(0,1/6), col="skyblue2",
     main = "Sums on 1000 Rolls of a Pair of Dice")
   points(2:12, c(1:6, 5:1)/36, col="red", pch=19)
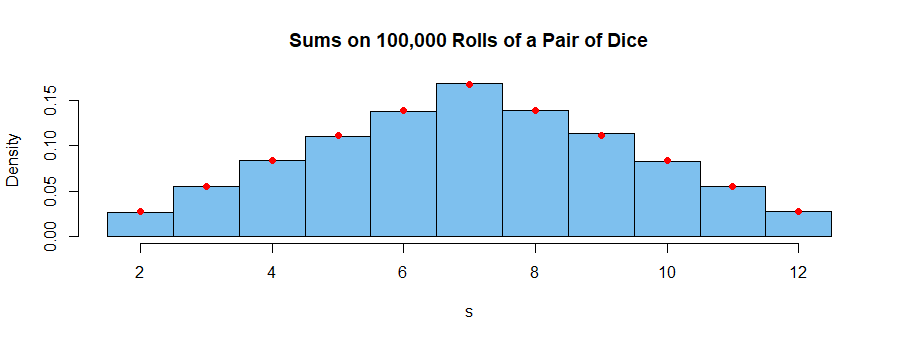
The histogram bars represent the simulated dataset. However, even with 1000 rolls of the dice, the histogram bars only approximate the PMF, for which exact values are shown by the red dots. As shown below, the PMF is more closely approximated by 100,000 rolls of the dice.
table(s)/10^5
s
      2       3       4       5       6       7       8       9      10      11      12
0.02706 0.05548 0.08363 0.10968 0.13786 0.16807 0.13890 0.11282 0.08303 0.05547 0.02800


