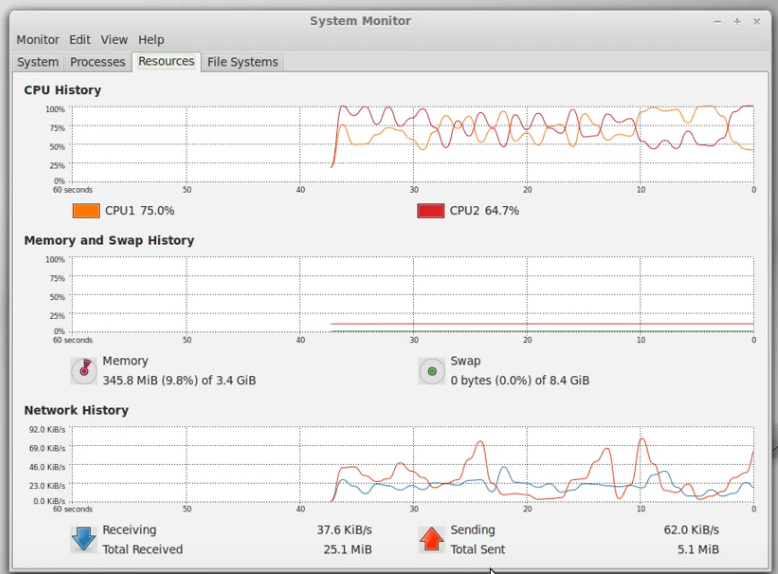
This is a type of chart that horizontally scrolls as new data appears. It's used to register the history across time of some data. Commonly used for monitoring as well.
1 Answer
There is no specific name for this type of updating, but it is a form of dynamic time-series plot. At any given time, the plot itself is merely a time-series plot based on a particular set of data; since new data are added as received, it makes sense to say that this is a form of dynamic plot (see e.g., here). The notion of a dynamic plot is broader than this, since it can refer to any kind of updating either by automation or by user input.

