Correct me if I am wrong anywhere.
- I understand PCA is used to determine what component(s) of a given dataset could be of more use than the other.
- By #1, I understand, for a structured dataset (with n columns and k rows), PCA will help us determine what column(s) could be useful to predict the outcome.
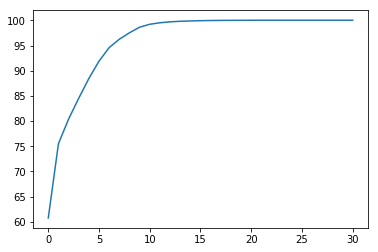
- Plotting the
explained_variance_will show us, graphically, what components are useful, that is to say, if the graph begins to straighten, we may discard the variables there. - Here's my graph. There are 31 variables (columns) and the graph starts to straighten out at 11-isih, I guess?
- So from what I have understood about PCA, we may discard the variables from 11 and beyond and the model built using this would still manage to score well.
And here lies my confusion: In the X axis, what number correspond to what variables? Like, does 1 mean that first columns of the dataframe? Obviously not, right?

