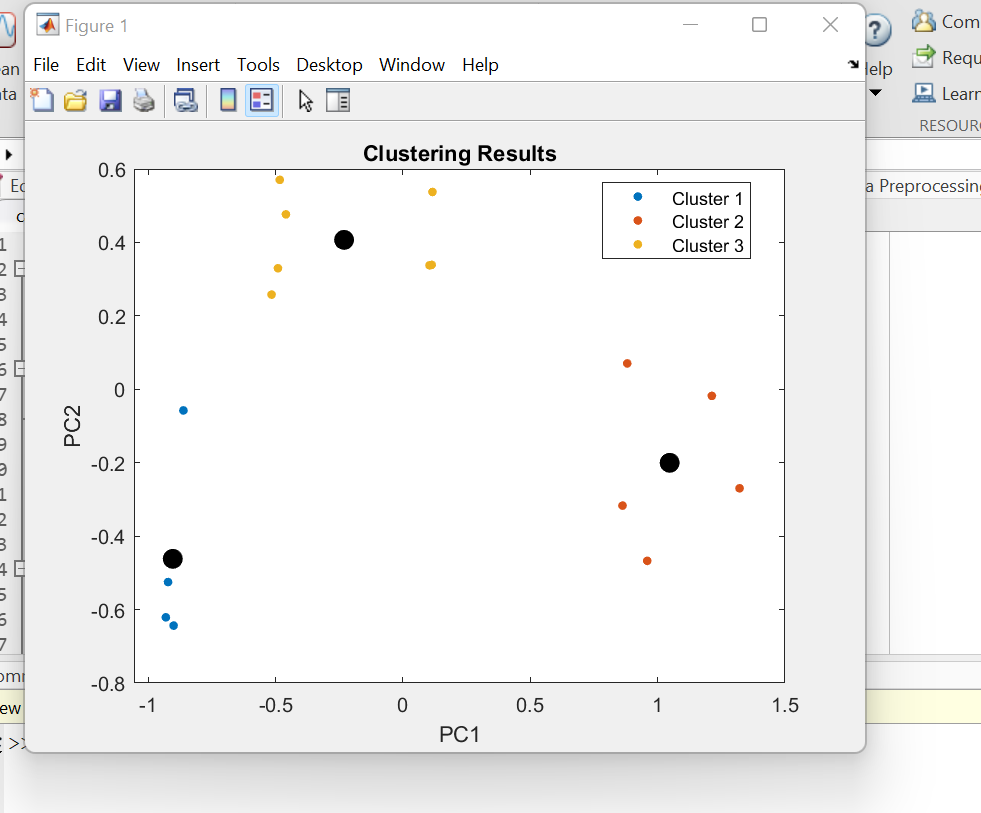
 I have a dataset containing 20 columns and 200 rows. This is an unlabeled dataset and I applied PCA to this dataset for dimensionality reduction. After successfully using PCA, I received a dataset with 2 columns(PC1 & PC2) and 200 rows. Then I executed the k-means algorithm on the output dataset(200x2). In the end, I got a graph plotting 5 clusters(X-axis is PC1 and Y-axis is PC2). But, how can we understand what X and Y axis on the graph represents? Also, how is it possible to figure out the understanding from this final graph when I don't have any clue about the values I obtained from PCA?
-
$\begingroup$ Are you sure 2 PCs suffice? How much % variance do they capture? To try to interpret the meaning of a PC you will have to use loadings. But a more straightforward way to understand the differences between the clusters would be to compare them on each of the 20 original features. On some, they will differ, on some, will not. $\endgroup$– ttnphnsCommented Jun 3, 2022 at 10:03
-
$\begingroup$ @ttnphns 2 PCs constitute more than 70% variance. So I believe that will be sufficient. As I'm working on MATLAB, how is it possible to compare PCs with each column using loading? Actually, I tried to search for an example, but I couldn't find one. Please help me with this. $\endgroup$– KrishnaCommented Jun 3, 2022 at 14:47
-
$\begingroup$ Here is pca steps, on iris data. Follow it and compare what you get in Matlab. Be careful with terminology. Some programs incorrectly call eigenvector coefficients the loadings (I don't know how Matlab is at that). $\endgroup$– ttnphnsCommented Jun 3, 2022 at 16:22
1 Answer
Your first question: With 20 columns in your dataset, it is probably difficult to "understand" what the two first PCs "mean" unless they happen to be very easy linear combinations of only few of your features. But it doesn't hurt to check. Your PCA algorithm should give you the linear combination of the first PCs from your features.
Your second question: This method is mainly giving you the clustering, i.e. the grouping of your data. Knowing which observations "belong together" is often quite valuable. Gleaning additional information from e.g. the position of the clusters in your PCA subspace is probably rather involved.
Also note, that PCA preprocessing can change the true clustering of your data quite a bit. E.g. it could easily happen that the projection to your two-dimensional PCA subspace maps two perfectly separated clusters into a single cluster. But you probably have your reasons why you do PCA.
-
$\begingroup$ At the end of K-means clustering, a graph was generated representing the clusters with PC1(Principal Component) and PC2 as X & Y-axis. I was using MATLAB and was able to generate the cluster numbers corresponding to each row in the table. But, I would like to know what this clusters represent. For Eg, Is cluster 1 means Good, cluster 2 is average, etc. $\endgroup$– KrishnaCommented Jun 2, 2022 at 16:21
-
$\begingroup$ @Krishna Clustering is for grouping, so you know that some observations belong together while others don't. What you seem to look for is assigning labels ("good", "average") to your data. That's called classification. $\endgroup$– frankCommented Jun 2, 2022 at 18:32
-
$\begingroup$ I believe working on a 2D graph with meaningful vectors, even the clusters can be grouped. So each data point in a cluster can be labeled accordingly. $\endgroup$– KrishnaCommented Jun 2, 2022 at 19:47
