0
$\begingroup$

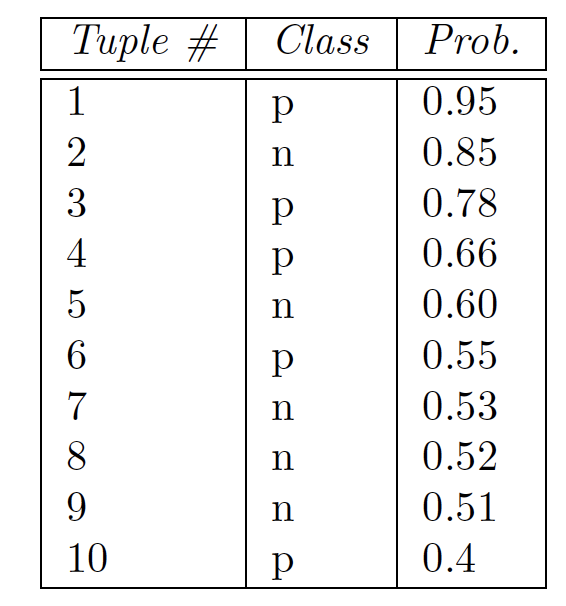
Below is a table of tuples that contain class probabilities for a ROC curve. How can I compute the TPR (True Positive Rate) and FPR (False Positive Rate) at the thresholds 0.78 and 0.53?

Table of probabilities

Note: the solutions to TPR(0.78) = 0.4, and FPR(0.53) = 0.6. I'm just not sure how to find them (or the missing two).

$\endgroup$

1 Answer 1

0
$\begingroup$

The TPR(0.78) = 0.4 because at a cut off of 0.78, there are 2 values correctly identified as positive out of the total 5 positive values (2/5). The FPR(0.53) = 0.6 because there are 3 negative values incorrectly identified as positive out of 5 total negative values (3/5).

$\endgroup$
1
  • $\begingroup$ Exactly what I was looking for--that makes so much sense. Thank you so much! $\endgroup$
    – Corey Abma
    Commented May 1, 2019 at 15:54

Your Answer

By clicking “Post Your Answer”, you agree to our terms of service and acknowledge you have read our privacy policy.

Not the answer you're looking for? Browse other questions tagged or ask your own question.