9
$\begingroup$

In R, I have estimated a logistic regression and calculated two predicted probabilities (with 95% confidence intervals) using the code shown:

set.seed(1234)

x = runif(100, 0, 1)
y = rbinom(100, size=1, prob = x)

model = glm(y ~ x, family = binomial("logit"))

newdata = data.frame(x = c(.25, .75))

predicted.probs = predict(model, newdata, type="response", se.fit = T)

upper.interval  = predicted.probs$fit + 1.96 * predicted.probs$se.fit
lower.interval  = predicted.probs$fit - 1.96 * predicted.probs$se.fit

Hmisc::errbar(newdata$x, predicted.probs$fit, upper.interval, lower.interval)

Rather than plotting these two predicted probabilities separately, I want to plot the difference between them, along with a 95% confidence interval for that difference. I know that the point estimate for that difference is simply the difference between the two predicted probabilities, but I do not know how to determine the confidence interval. I could simply add widths of the two original confidence intervals, but this seems wrong to me given that the two predicted probabilities are based on the same model and not independent.

Is there a way in R to calculate a confidence interval for this difference between two predicted probabilities?

$\endgroup$
7
  • 1
    $\begingroup$ You will have to either bootstrap or use the delta method to estimate the standard error of the difference in probabilities. R has functions/packages for both of these approaches. $\endgroup$ Commented Jun 2, 2019 at 7:09
  • $\begingroup$ Profile likelihood can also be used! $\endgroup$ Commented Nov 12, 2021 at 13:56
  • 2
    $\begingroup$ It would be good to see an example of the use of profile likelihood for such derived parameters. I've needed this in other contexts. The bootstrap is very easy to program but its confidence intervals will not be as accurate as profile likelihood. $\endgroup$ Commented Sep 14, 2022 at 14:08
  • $\begingroup$ From where is the function errbar ? $\endgroup$ Commented Sep 14, 2022 at 19:36
  • 2
    $\begingroup$ Your example uses a badly specified model, with a logit link instead of the identity link function which is how the data is generated. This makes the interpretation of the confidence intervals a bit difficult. It is not that there is no ideal parameter that can be estimated; the model does have some value for the parameters that make the logistic curve most closely resemble the linear curve of the true model. But, it is a bit weird. As a result of the misspecification and systematic error, you will overestimate the size of the random error and overestimate the size of the confidence interval. $\endgroup$ Commented Sep 15, 2022 at 7:31

4 Answers 4

5
+50
$\begingroup$

One way to do this will be profile likelihood. If we have a parameter vector $\psi$, profile likelihood is usually calculated for one of the components of $\psi$, but it can be defined for any parametric function of $\psi$. Below is a definition, suppose $L(\psi)$ is the likelihood function and interest (or focus) is on a scalar function $\theta = \theta(\psi)$, then $$ L_P(\theta) = \max_{\{\psi\colon \theta(\psi)=\theta \}} L(\psi)$$ The implementations of profile likelihood in R (elsewhere?) is not of these generality, so let us make it "by hand".

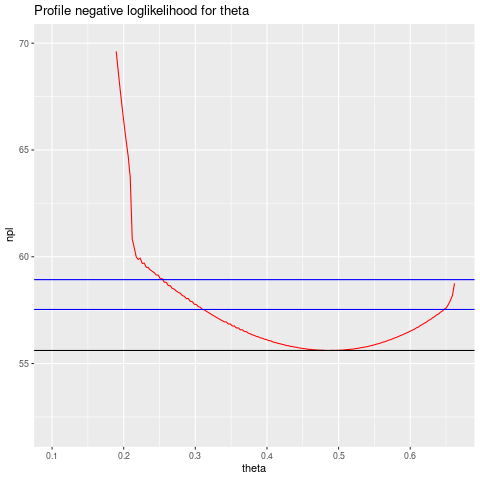
The model is $$ \DeclareMathOperator{\P}{\mathbb{P}} p_x= \P(Y=1 \mid X=x)= \frac1{1+e^{-\beta_0 - \beta_1 x}} $$ and the interest parameter $\theta$ is $$ \theta = p_{0.75} - p_{0.25} $$ It doesn't look promising to try to solve the optimization symbolically, so we try numerically. This is a first attempt, so maybe we can do better. First, a plot of the (negative) profile likelihood for $\theta$, using the data simulated in the question:

negative profile loglik for theta

the two blue lines are cutoffs for confidence intervals of 95 and 99%, respectively, based on quantiles from the reference chi-square distribution with 1 df. R code is below:

### First run code from question
library(bbmle)

make_negloglik <- function(y, x) {
   n <- length(y)
   stopifnot( n == length(x) )
   Vectorize( function(beta0, beta1) 
       sum(ifelse(y==0, log1p(exp(beta0  +  beta1*x)),
                                   log1p(exp(-beta0 - beta1*x)))) )
    }

negloglik <- make_negloglik(y, x)

mod.bb <- bbmle::mle2(negloglik,  start=list(beta0=-2, beta1=4))

mod.prof <- bbmle::profile(mod.bb)

plot(mod.prof) # Not shown 

grid <- expand.grid(beta0=seq(-2.8, -0.5, len=100),
                    beta1=seq(1.8, 7.1, len=100))
grid$negloglik <-  with(grid, negloglik(beta0, beta1)) 

P <- function(beta0, beta1, x) 1/( 1  + exp( -beta0 -beta1 * x))

theta <- function(beta0, beta1) P(beta0, beta1, 0.75) - P(beta0, beta1, 0.25)

### Adding theta as a column to data.frame grid:

grid$theta <- with(grid, theta(beta0, beta1))

profile_negloglik <- function(grid) {
    rt <- with(grid,  range(theta))
    seq_theta <- seq(rt[1], rt[2], len=201)
    delta <- diff(seq_theta[1:2])
    npl <- numeric(length=length(seq_theta))
    for (t in seq_along(seq_theta)) {
        tt <- seq_theta[t]
        npl[t] <- with(grid, min(grid[ (tt-delta/2 <= theta) & (theta <= tt + delta/2),
                                      "negloglik" ]))
        }
    return(data.frame(theta=seq_theta, npl=npl))
    }

npl_frame <- profile_negloglik(grid)

npl_min <- with(npl_frame, min(npl))

library(ggplot2)

ggplot(npl_frame, aes(theta, npl))  +  geom_line(color="red")  +
    ggtitle("Profile negative loglikelihood for theta")  +
    geom_hline(yintercept=npl_min)  +
    geom_hline(yintercept=npl_min +  
    qchisq(0.95, 1)/2, color="blue")  +
    geom_hline(yintercept=npl_min +  
    qchisq(0.99, 1)/2, color="blue")   +  ylim(52, 70)   

The idea of the code is:

  • Define a rectangle in parameter space given by individual 99% confidence intervals (calculated by profiling with the R package bbmle)
  • use expand.grid to cover the rectangle
  • add to the grid data frame a column with the negative loglikelihood, another column with $\theta$
  • Find the range of $\theta$ and subdivide it in many small intervals
  • For each of the intervals, find the minimum negative log likelihood over the interval, and associate that with the midpoint
  • finally, plot this as an approximation of the negative profile loglikelihood function of $\theta$.

As a comparison, let us also calculate an approximate 95% confidence interval using the delta method. Calculations in R:

 theta_grad <- deriv(expression(  1/( 1  + exp( -beta0 -beta1 * 0.75)) 
              -  1/( 1  + exp( -beta0 -beta1 * 0.25))), 
              c("beta0", "beta1"), function.arg=TRUE)

grad <- theta_grad(coef(model)[1], coef(model)[2])

grad
(Intercept) 
  0.4880566 
attr(,"gradient")
           beta0      beta1
[1,] -0.05555914 0.06582565

grad <- attr(grad, "gradient")
V <- vcov(model)

theta.se <- sqrt( grad %*% V %*% t(grad)  )

 ( CI <- c(0.4881 -2*theta.se, 0.4881  + 2*theta.se ) )
[1] 0.3154351 0.6607649

which is quite close to the profile interval.

$\endgroup$
4
  • 2
    $\begingroup$ Given that the software produces a covariance matrix for the coefficient estimates, there is a far simpler solution: use it to find the standard error of the difference. $\endgroup$
    – whuber
    Commented Sep 14, 2022 at 23:41
  • $\begingroup$ I agree with whuber here. If I remember correctly, the equation to obtain the standard error of the difference given the standard errors of each individual component is simply sqrt(se_0^2 + se_1^2). $\endgroup$
    – Denzo
    Commented Sep 15, 2022 at 7:32
  • 1
    $\begingroup$ @Denzo the software gives the error for coefficient estimates. That's different from the standard error of individual components like $p_{0.25}$ and $p_{0.75}$. And also, even if you would have the standard errors for those, then you can not simple add them because of potential correlation. What you would need to use is the Delta method, which is applied in the final section of this answer. $\endgroup$ Commented Sep 15, 2022 at 7:36
  • $\begingroup$ I don't think that is correct. The predict function with type="response" does return predicted probabilities with associated standard errors. The standard errors do not refer to the coefficient estimates. That being said, I am not sure if the simple equation works. Once I have finished work I will try something out and get back here. $\endgroup$
    – Denzo
    Commented Sep 15, 2022 at 8:08
4
$\begingroup$

The emmeans package provides an easy and reliable way to calculated an asymptotic confidence interval for the difference in probabilities via the multivariate delta method (see also @kjetilbhalvorsen's answer for computational details):

library(emmeans)

x_pred <- c(0.75, 0.25)
emm_resp <- emmeans(model, ~ x, at = list(x = x_pred), regrid = "response")
# infer = c(TRUE, TRUE) gives test statistic w/ corresponding p-value, and CI
pairs(emm_resp, infer = c(TRUE, TRUE))
# contrast      estimate     SE  df asymp.LCL asymp.UCL z.ratio p.value
# x0.75 - x0.25    0.488 0.0863 Inf     0.319     0.657   5.653  <.0001
# 
# Confidence level used: 0.95 
$\endgroup$
6
  • 1
    $\begingroup$ Emphasis on asymptotic AKA "we don't know how accurate it is except in the limit when N is way beyond 10,000,000". $\endgroup$ Commented Sep 15, 2022 at 11:45
  • 1
    $\begingroup$ @FrankHarrell I don't think there is a "standard" confidence interval that doesn't (implicitly) rely on asymptotic arguments/distributions in the given situation. And it's not hard to study the small-sample properties via simulations. $\endgroup$
    – statmerkur
    Commented Sep 15, 2022 at 13:38
  • 1
    $\begingroup$ It was a general comment about using asymptotics in applied problems. Here I'd use the profile likelihood method so nicely detailed above. $\endgroup$ Commented Sep 16, 2022 at 16:59
  • 2
    $\begingroup$ @FrankHarrell That profile method still uses chi-square quantiles to obtain the CI. So isn't it asymptotic too? $\endgroup$
    – Russ Lenth
    Commented Sep 16, 2022 at 19:58
  • 1
    $\begingroup$ Good point. It is asymptotic, but (1) doesn't require as large an N to be accurate, (2) is transformation-invariant, unlike Wald (e.g. profile likelihood CI for a hazard ratio equal the antilog of the limits for a log hazard ratio), and (3) works fine even when there is complete separation (Hauck-Donner effect). $\endgroup$ Commented Sep 17, 2022 at 15:25
2
$\begingroup$

Method: Simulation assuming multivariate normality of coefficients

You could use the coefficients and their covariance matrix returned by the model to do simulations (Carsey & Harden 2013, King et al. 2000). The procedure works as follows:

  1. Estimate the model and store the coefficients and covariance matrix.
  2. Draw randomly from a multivariate normal distribution in which the means and covariance matrix are set to the stored values from step 1.
  3. Repeat step 2 a large number of times and store the random draws of each simulation.
  4. Calculate the quantities of interest for each draw of coefficients and store them.
  5. Summarize the stored quantities of interest (e.g. with the mean and quantiles).

Here's the example with your simulated data:

library(MASS)

set.seed(1234)

x <- runif(100, 0, 1)
y <- rbinom(100, size=1, prob = x)

model <- glm(y ~ x, family = binomial("logit"))

# Store coefficients and covariance matrix

betas <- coef(model)
covmat <- vcov(model)

# Draw from a multivariate normal distribution

n_draws <- 1e5

model_sim <- mvrnorm(n_draws, mu = betas, Sigma = covmat)

# Function to calculate the quantity of interest (difference of probabilities)

calc_probdiff <- function(coefs, pred1, pred2) {
  plogis(as.matrix(pred1) %*% coefs) - plogis(as.matrix(pred2) %*% coefs)
}

# Apply the function on the simulated coefficients

res <- apply(model_sim, 1, calc_probdiff, pred1 = data.frame(intercept = 1, x = 0.75), pred2 = data.frame(intercept = 1, x = 0.25))

# Visualize and summarize

hist(res)

mean(res)

[1] 0.4781587

quantile(res, c(0.025, 0.975))

     2.5%     97.5% 
0.2961805 0.6334994
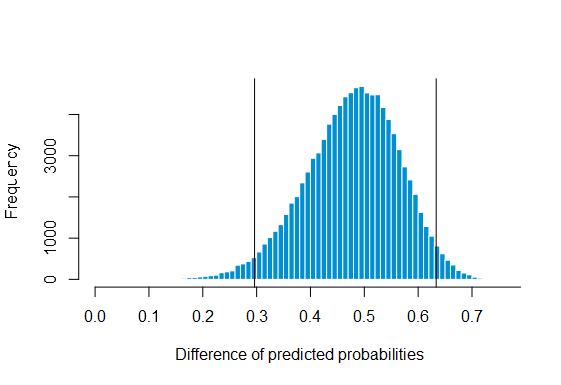
Histogramm

Based on this simulation using $100\,000$ random draws, the difference of predicted probabilities is $0.478$ with a corresponding 95% confidence interval of $(0.296; 0.633)$. This is similar to the other answers.

The package clarify simplifies these steps greatly. Here is it in action (output is not shown):

library(MASS)
library(clarify)

set.seed(1234)

x <- runif(100, 0, 1)
y <- rbinom(100, size=1, prob = x)

model <- glm(y ~ x, family = binomial("logit"))

# Simulate coefficients from the model
s <- sim(model, n = 1e4)

# Define the function that calculates the difference between the predicted probabilities
my_fun <- function(fit) {
  predict(fit, newdata = data.frame(x = 0.75), type = "response") - predict(fit, newdata = data.frame(x = 0.25), type = "response")
}

# Apply the function to the simulated coefficients earlier
est1 <- sim_apply(s, FUN = my_fun)

# Plot and summaries the results
plot(est1, method = "quantile", reference = TRUE)
summary(est1, ci = TRUE, level = 0.95, method = "quantile")

Method: Parametric bootstrap

A parametric bootsrap confidence interval can be calculated using the following steps (Adjei & Karim 2016):

  1. Estimate the model and store the predicted probabilities $\hat{\pi}_i$.
  2. Draw a bootstrap sample $(x, y^{*})$ where $y^{*}_i=\operatorname{Ber}(\hat{\pi}_i)$.
  3. Fit the model with the data obtained in step 2.
  4. Estimate the difference in predicted probabilities from model in step 3 and store them.
  5. Repeat steps 2-4 a large number of times.
  6. Summarize the stored differences.

Again in R:

set.seed(1234)

x <- runif(100, 0, 1)
y <- rbinom(100, size = 1, prob = x)

model <- glm(y ~ x, family = binomial("logit"))

pihat <- predict(model, type = "response")

param_boot <- replicate(1e4, {
  ystar <- rbinom(100, 1, prob = pihat)
  mod <- glm(ystar~x, family = binomial)
  c(plogis(matrix(c(1, 0.75), ncol = 2) %*% matrix(coef(mod))) - plogis(matrix(c(1, 0.25), ncol = 2) %*% matrix(coef(mod))))
})

mean(param_boot)

[1] 0.4903014

quantile(param_boot, c(0.025, 0.975))

     2.5%     97.5% 
0.3185213 0.6580579

Based on this simulation using $10\,000$ replications, the difference of predicted probabilities is $0.49$ with a corresponding 95% confidence interval of $(0.319; 0.658)$.

Method: Nonaparametric bootstrap

A nonparametric bootsrap confidence interval can be calculated using the following steps (Adjei & Karim 2016, see also my answer here):

  1. Draw $n$ observations from the original dataset of size $n$ with replacement.
  2. Fit the model using the data obtained in step 1.
  3. Estimate the difference in predicted probabilities from model in step 2 and store them.
  4. Repeat steps 1-3 a large number of times.
  5. Summarize the stored differences.

Here's how you could do it in R:

set.seed(1234)

x <- runif(100, 0, 1)
y <- rbinom(100, size = 1, prob = x)

dat <- data.frame(x, y)

nonparam_boot <- replicate(1e4, {  
  mod <- glm(y~x, family = binomial, data = dat[sample.int(100, replace = TRUE), ])  
  c(plogis(matrix(c(1, 0.75), ncol = 2) %*% matrix(coef(mod))) - plogis(matrix(c(1, 0.25), ncol = 2) %*% matrix(coef(mod))))  
})

mean(nonparam_boot)

[1] 0.4906483

quantile(nonparam_boot, c(0.025, 0.975))

     2.5%     97.5% 
0.3266630 0.6551795

Based on the nonparametric bootstrap using $10\,000$ replications, the difference of predicted probabilities is $0.49$ with a corresponding 95% confidence interval of $(0.327; 0.655)$.

References

Adjei, I. A., & Karim, R. (2016). An application of bootstrapping in logistic regression model. Open Access Library Journal, 3(9), 1-9.

Carsey, T. M., & Harden, J. J. (2013). Monte Carlo simulation and resampling methods for social science. Sage Publications.

King, G., Tomz, M., & Wittenberg, J. (2000). Making the most of statistical analyses: Improving interpretation and presentation. American journal of political science, 347-361.

$\endgroup$
3
  • 1
    $\begingroup$ Compared with the profile likelihood (and also delta method) intervals this is shifted downward. Probably because your method ignores the asymmetry of the likelihood. $\endgroup$ Commented Sep 15, 2022 at 15:12
  • 2
    $\begingroup$ @kjetilbhalvorsen the delta method ignores the asymmetry as well. These simulations are doing exactly the same what the delta method computes approximately. $\endgroup$ Commented Sep 15, 2022 at 15:20
  • 1
    $\begingroup$ The usual references for the first method you describe are Krinsky and Robb (1986, 1990, & 1991). In the simulation studies I've read it was (perhaps surprisingly) not superior to the delta method. Note that this method can also be seen as a parametric bootstrap method. $\endgroup$
    – statmerkur
    Commented Sep 15, 2022 at 17:34
0
$\begingroup$

As briefly discussed in my answer to the other poster, you can simply calculate the overall standard error from the two standard errors and use the normal approximation to get the confidence interval. The overall standard error is simply sqrt(se_0^2 + se_1^2). The following function implements this (in a very crude fashion):

get_diff_ci <- function(pred) {
  diff <- pred$fit[2] - pred$fit[1]
  diff_se <- sqrt(pred$se.fit[1]^2 + pred$se.fit[2]^2)
  upper <- diff + 1.96 * diff_se
  lower <- diff - 1.96 * diff_se
  out_dat <- data.frame(diff=diff, lower=lower, upper=upper)
  return(out_dat)
}

So in your example it would be:

set.seed(1234)

x = runif(100, 0, 1)
y = rbinom(100, size=1, prob = x)

model = glm(y ~ x, family = binomial("logit"))

newdata = data.frame(x = c(.25, .75))

predicted.probs = predict(model, newdata, type="response", se.fit = T)

get_diff(predicted.probs)

To "prove" that this is appropriate, a small monte-carlo simulation using the original example given:

set.seed(1234)

n_repeats <- 10000

out <- vector(mode="list", length=n_repeats)
for (i in 1:n_repeats) {
  x = runif(100, 0, 1)
  y = rbinom(100, size=1, prob = x)
  
  model = glm(y ~ x, family = binomial("logit"))
  
  newdata = data.frame(x = c(.25, .75))
  pred <- predict(model, newdata, type="response", se.fit=T)
  
  out[[i]] <- get_diff_ci(pred)
}
out <- dplyr::bind_rows(out)

true_diff <- mean(out$diff)
out$true_in_ci <- true_diff <= out$upper & true_diff >= out$lower
mean(out$true_in_ci)

Here I simply repeated your simulation 10000 times and calculated the difference and confidence interval of the two predicted probabilities for each repetition. The mean of the individual differences of the probabilities can be used as an estimate for the true underlying difference (because I am too lazy to derive the actual value). By simply checking what proportion of the estimated CIs contain this true value we can judge whether the confidence interval is correct. In this case the confidence intervals contain the true value 94.59% of the time, which is almost exactly equal to the desired 95%. The discrepancy is probably due to the rounding of the 1.96 z-value and simulation error.

EDIT (15.06.2022): As pointed out by @Sextus Empiricus, this method does not seem to work as well as it seemy by just looking at the single monte-carlo study and should probably not be used.

$\endgroup$
3
  • 2
    $\begingroup$ I don't know why your monte carlo simulation get's close to 95% but the method is not right. To compute the standard error of a linear combination of variables, you will also need to consider the correlation between the variables. The formula that you work ignores the correlation. It is possibly because the results at the points at $.25$ and $.75$ correlate less strongly (or they compensate for the error that I mentioned under the post of the OP). When you use two points that are closer like $.70$ and $.75$, then you should get a different result. $\endgroup$ Commented Sep 15, 2022 at 9:59
  • $\begingroup$ You seem to be correct. If i use .70 and .75 instead, the coverage is 100%. If one substitutes .1 and .9 the coverage is only 89.3% so this method probably shouldn't be used. I should have been more careful when interpreting the monte-carlo results. $\endgroup$
    – Denzo
    Commented Sep 15, 2022 at 10:09
  • 1
    $\begingroup$ This is incorrect in general because it neglects the potentially strong correlation between the two predictions. You need to apply the full variance-covariance matrix of the parameter estimates. One reason this example deceives you is that it is a poor one: there is little variation of the expected response over this range of explanatory values. $\endgroup$
    – whuber
    Commented Sep 15, 2022 at 14:40

Your Answer

By clicking “Post Your Answer”, you agree to our terms of service and acknowledge you have read our privacy policy.

Not the answer you're looking for? Browse other questions tagged or ask your own question.