3
$\begingroup$

I fitted the following multinomial regression:

library(car)
p1<-c(1,2,3,4,3,4,3,4,3,2,1,2,1,2,1,2,3,4,3,2,3,4,3,2,2,2,3,4,3,3,4,3,4)

d1<-c(1,2,3,4,3,4,3,4,3,2,1,2,1,2,1,2,3,4,3,2,3,4,3,2,1,2,3,4,3,2,2,2,1)

d1<-as.ordered(d1)

library(nnet)
test<-multinom(p1~d1)
predi<-expand.grid(d1=c("1","2","3","4"))

pre<-predict(test,predi,type="probs")

The output is a table of the predicted probabilities for every coefficient. I can also order the results for the confidence interval of the coefficents with:

confint(test)

My question is: is it possible to get the results for the confidence interval for the predicted probabilities? It means for every amount in the "pre" output! PS: I found a similar question here in ["plotting confidence intervals"][1]Plotting confidence intervals for the predicted probabilities from a logistic regression

The main answer is perfect for my question, but I do not know how to combine with multinomial regression. I hope you understand my bad english :) Thank you for your help

$\endgroup$
5
  • $\begingroup$ You may calculate them yourself using the SEs you get from summary(test)... $\endgroup$ Commented Aug 15, 2013 at 12:06
  • $\begingroup$ Thank you for your answer.hmm...how should I do this? Do you have a concrete idea? $\endgroup$ Commented Aug 15, 2013 at 13:12
  • 1
    $\begingroup$ You mean mathematically? You know how to calculate a CI (if not, look it up!!)? Try to replicate the CIs you get from confint(test) and then you can go on... $\endgroup$ Commented Aug 15, 2013 at 13:39
  • 1
    $\begingroup$ My problem is, that I do not know how to calculate predicted probabilities with my test results and my CI in R. $\endgroup$ Commented Aug 15, 2013 at 14:32
  • $\begingroup$ It would be great, to get some more advices. I don't know how to build this in R. The problem is, that I have problems to rebuild the predict() output and with it the CI for the predicted probabilities. Thanks a lot $\endgroup$ Commented Aug 16, 2013 at 6:12

1 Answer 1

3
$\begingroup$

You can accomplish this with the effects package. Now, for a reproducible example:

library(nnet)

set.seed(892)

x <- c(rnorm(100, 10, 1))

y <- factor(rep_len(1:3, 100))

fit <- multinom(y ~ x)

That's the model, now let's get some predicted probabilities.

fit.eff <- Effect("x", fit)
data.frame(fit.eff$model.matrix, fit.eff$prob, fit.eff$lower.prob, 
           fit.eff$upper.prob)

  X.Intercept.  x   prob.X1   prob.X2   prob.X3 L.prob.X1  L.prob.X2 L.prob.X3 U.prob.X1 U.prob.X2 U.prob.X3
1            1  8 0.4211010 0.1119309 0.4669680 0.2218766 0.03696574 0.2565056 0.6498212 0.2927143 0.6898823
2            1  9 0.3962450 0.1958841 0.4078709 0.2704241 0.10428467 0.2805946 0.5374796 0.3376147 0.5488354
3            1 10 0.3478412 0.3198070 0.3323518 0.2583849 0.23216366 0.2442887 0.4494968 0.4223378 0.4339321
4            1 11 0.2780225 0.4753991 0.2465784 0.1689652 0.33171768 0.1449846 0.4217471 0.6232722 0.3871286

Which gives the probabilities for factor "1" in X, prob.X1, its lower confidence interval L.prob.X1 and its upper interval U.prob.X1.

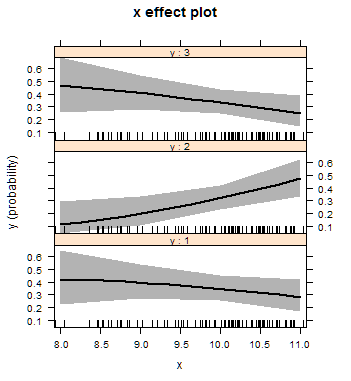
effects will helpfully plot the values for you as well, which is its main purpose anyway.

plot(fit.eff)

Edit: added some code to clarify which levels of x were being predicted. Note that Effect() automatically cuts numerical predictor variables based on grid.pretty, which might not be what you typically want. In this case, you need to set the xlevels option, like this: fit.eff <- effect("x", fit, xlevels = list(x = c(2, 4, 6, 8, 10))).

$\endgroup$

Your Answer

By clicking “Post Your Answer”, you agree to our terms of service and acknowledge you have read our privacy policy.

Not the answer you're looking for? Browse other questions tagged or ask your own question.