I want to put acoustic panels in a space to help reduce reverberation (RT60 is a measurement of how long it takes sound to decay by 60 dB). I have already calculated how many panels should theoretically be needed, but I decided to perform an experiment.
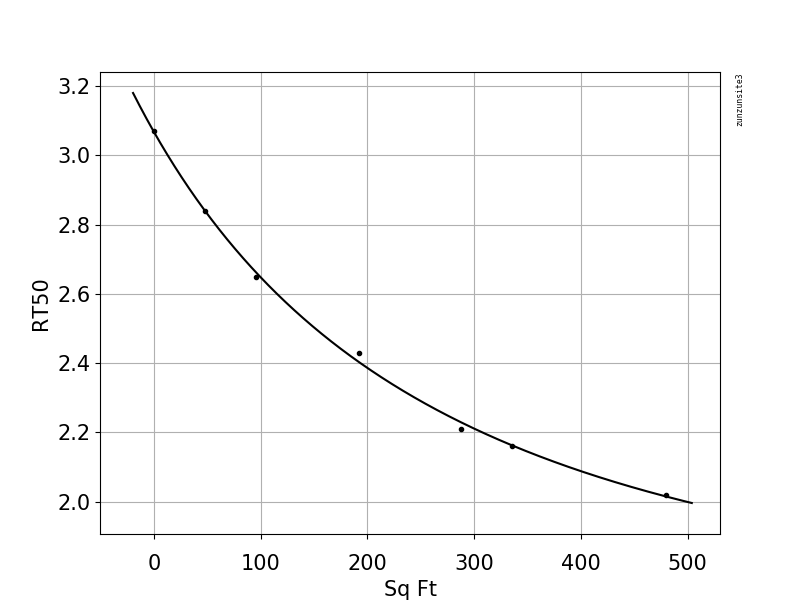
I had a number of panels on hand and set them up temporarily around the room and took periodic measurements as I set them up. I did not have enough panels to lower the reverberation to my final goal but I was hoping to use the measurements to create a trendline that I could use to extrapolate to predict how many panels it would take to achieve my desired goal.
Here is my actual measured data:
Sq Ft Panels    RT60
------------    ----
  0             3.07
 48             2.84
 96             2.65
192             2.43
288             2.21
336             2.16
480             2.02
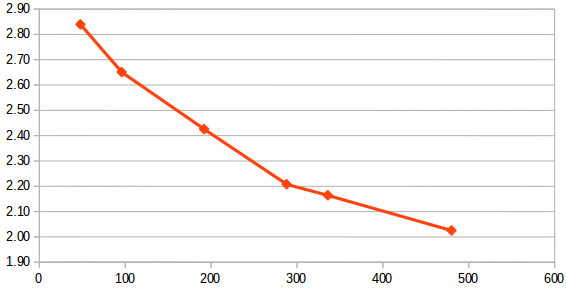
and here is a graph of this data:

So, how do I determine what kind of function likely represents this data so I can then predict what a larger value for the Sq Ft Panels (like 1000) would yield for RT60?

