0
$\begingroup$

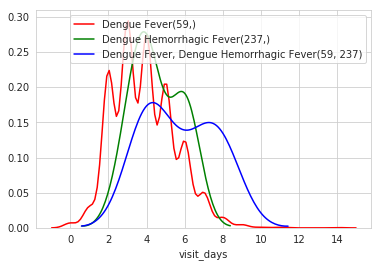
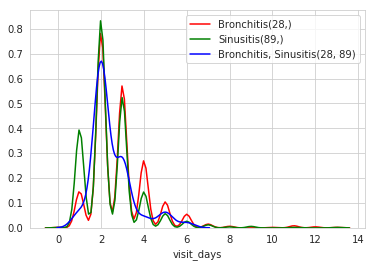
given that X and Y are not mutually exclusive, is there anyway to calculate PDF(X,Y) from PDF(X) and PDF(Y)? Following are a few plots made from the dataset. enter image description here
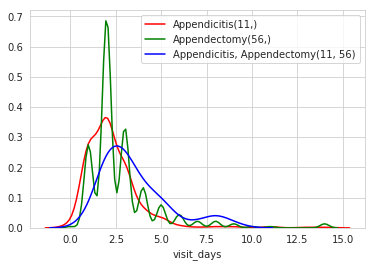
In above image i have to find how PDF(11,56) is related to PDF(11), PDF(56). And in this case X and Y are not independent, but this might not always be true. enter image description here enter image description here
the dataset looks like this:

    diagnosis_ids   visit_days
0   (602,)      2
4   (3, 131)    2
5   (13,)       1
6   (442,)      3
7   (761,)      8
9   (28,)       2
10  (17,)       1
11  (13,)       1
12  (44,)       5
13  (9,)        2
14  (146,)      16
16  (9,)        2
17  (146, 336)  7
19  (88,)       5
20  (9,)        1

shape==> 75000 x 2
number of unique diagnosis_ids == 2000
visit_days == length of hospital stay in days.
max(len(diagnosis_ids)) = 6 (this is maximum len available in dataset, new entries can be longer than 6)

the final goal is to predict visit_days for a given combination of diagnosis_ids.

$\endgroup$
3
  • $\begingroup$ What do you mean by mutually exclusive? By PDF you mean probability densities? $\endgroup$ Commented Jun 11, 2019 at 9:07
  • $\begingroup$ yes PDF's are probability density functions and by mutually exclusive i mean any diagnosis_id can be combined with any other diagnosis_id, means a patient can have more than one diagnoses. $\endgroup$
    – dshrikant
    Commented Jun 11, 2019 at 9:16
  • $\begingroup$ This may help: math.chalmers.se/~rootzen/highdimensional/SSP4SE-appA.pdf if you are assuming normal distribution. $\endgroup$
    – Zhubarb
    Commented Jun 11, 2019 at 10:14

1 Answer 1

1
$\begingroup$

I'm not sure if your question is about finding P(X, Y) in general or do you mean it for a concrete example.

In general your question translates into ill-posed problem: there can be many such distributions. Read on joint distribution on wikipedia.

In your example on the other hand your data defines concrete distribution P(X,Y), so it's possible to calculate it using 2-d histograms, like in this question (Python)

$\endgroup$
1
  • $\begingroup$ please explain how to calculate it using 2d histograms. The question is about finding P(X1, X2, ..Xn) from the dataset. While many diagnosis_combinations are already present in dataset many new can be created. The final goal is to spit out a number for visit_days given a combination of diagnosis_ids. $\endgroup$
    – dshrikant
    Commented Jun 11, 2019 at 10:15

Your Answer

By clicking “Post Your Answer”, you agree to our terms of service and acknowledge you have read our privacy policy.

Not the answer you're looking for? Browse other questions tagged or ask your own question.