There's no need to integrate anything if you know the cdf of the kernel itself. I believe this is straightforward for all the common kernels.
Note that
a KDE is a mixture density
the cdf of a mixture is the mixture of the cdfs.
that is, if $\hat{f}(x)=\frac{1}{n}\sum_i f_i(x)$ is your KDE at $x$, then
$\hat{F}(x)=\frac{1}{n}\sum_i F_i(x)$.
Take a Gaussian kernel for example. If $x_i$ are your observations, $f_i$ is $\frac{1}{\sigma} \phi(\frac{x- x_i}{\sigma})$ and $F_i=\Phi(\frac{x-x_i}{\sigma})$, where commonly $\sigma$ is defined as the bandwidth (in some implementations the bandwidth may be some multiple of $\sigma$).
Indeed, R does that (defines bandwidth = $\sigma$) for all its kernels, not just the Gaussian one. But it's easy as long as you can convert a bandwidth to the parameters of the kernel so you can call a function for the cdf.
So you can evaluate the cdf of your mixture at any $x$ in linear time. If you need it to be able to calculate $\hat{F}$ fast, you could evaluate it over a grid (fine enough to get sufficient accuracy), and use interpolation in between (e.g. in R this is easily done with approxfun; no doubt Python has a convenient way to do something similar)
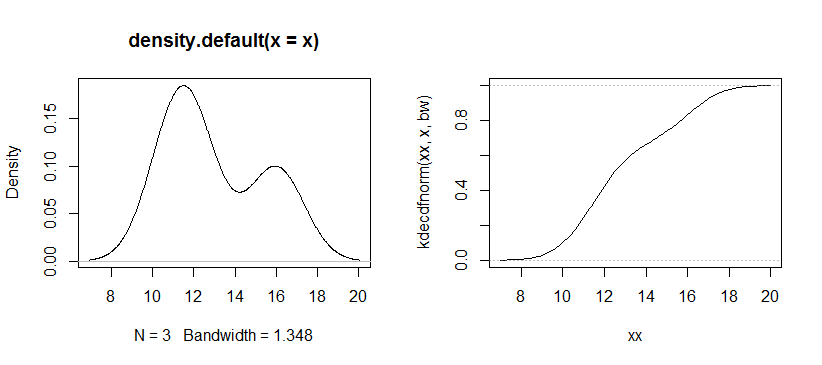
Here's an example of a plot of a kde and cdf for a Gaussian kernel.

Here's the code I used (it was done in R - this is a quick kludge to show the idea, a proper function would be checking arguments, providing better info, labelling axes, letting you specify the kernel and so on). The workhorse is the third line, which defines the function that does all the actual calculation of the cdf, everything else is details of data or plotting.
x <- c(11,12,16) #data
xx <- seq(7,20,.1) # plot values for the cdf
kdecdfnorm <- function(x,xdat,bw) rowMeans(pnorm(outer(x,xdat,"-"),0,bw)) #cdf of KDE
opar <- par() # save graphics parameter settings
par(mfrow=c(1,2)) # 1 x 2 plot grid
kde <- density(x)
plot(kde)
bw <- kde$bw
plot(xx,kdecdfnorm(xx,x,bw),type="l")
abline(h=c(0,1),col=rgb(.5,.5,.5,.5),lty=3)
par(opar) # restore graphics parameters
How does that rowMeans(pnorm(outer(x,xdat,"-"),0,bw)) work?
rowMeans is just doing $\frac{1}{n}\sum_{i=1}^{n}$ of its argument
pnorm is computing the cdf of the Gaussian kernel terms, with bandwidth at its last argument
the first argument to pnorm is just $x-x_i$ over the data values ($x_i$) and the various x's we want to find the curve at
which is to say we're just computing $\frac{1}{n}\sum_i \Phi(\frac{x-x_i}{\sigma})$ in a quite direct way, across whatever values for $x$ we want to calculate it at.

