1
$\begingroup$

I would like to determine CDF and PDF from quantiles that I have determined via quantile regression. I have read here in the forum (Find the PDF from quantiles) that it is possible to interpolate this via the integral of a B-spline The PDF should then be determined via a normal evaluation. Unfortunately I did not understand why I have to use the integral of the B-spline, how can I ensure that the CDF is monotonically increasing and how I then get to the derivative (the PDF)? Can someone help me please?

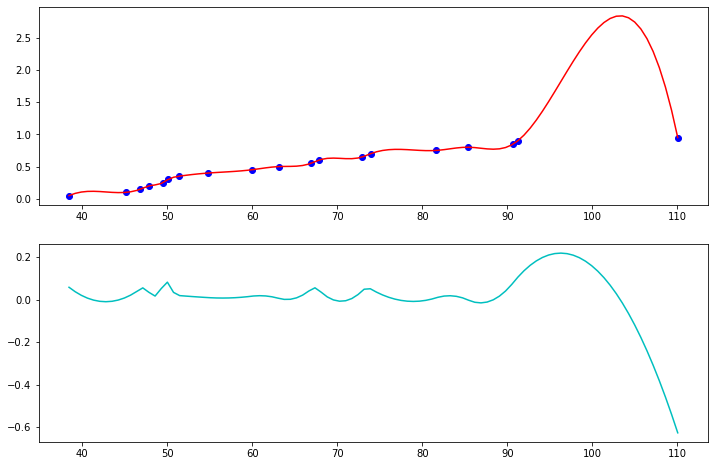
This is how it currently looks for me:

import scipy.interpolate
import numpy as np

x = np.array([ 38.45442808,  45.12051933,  46.85565437,  47.84576924,
        49.50084204,  50.09833301,  51.3717386 ,  54.85307741,
        59.91982266,  63.11786854,  66.90037244,  67.84446378,
        72.96120777,  73.92993279,  81.63075081,  85.42178836,
        90.70554533,  91.2393176 , 110.03872988])

y = np.array([0.05, 0.10, 0.15, 0.20, 0.25, 0.30, 0.35, 0.40, 0.45, 0.50, 0.55, 0.60, 0.65, 0.70, 0.75, 0.80, 0.85, 0.90, 0.95])

t,c,k = scipy.interpolate.splrep(x, y)
spline = scipy.interpolate.BSpline(t, c, k, extrapolate=False)
d_spline = spline_.derivative()

N = 100
xmin, xmax = x.min(), x.max()
xx = np.linspace(xmin, xmax, N)

fig, ax = plt.subplots(2,1, figsize =(12, 8))

ax[0].plot(x, y, 'bo', label='Original points')
ax[0].plot(xx, spline(xx), 'r', label='BSpline')

ax[1].plot(xx, d_spline(xx), 'c', label='BSpline')

enter image description here

My approach doesn't really work well unfortunately and I can't find any numerical examples to help me. I am grateful for all comments and remarks!

Thank you!

$\endgroup$
4
  • 1
    $\begingroup$ "I have read here in the forum that it is possible to interpolate this via the integral of a B-spline The PDF should then be determined via a normal evaluation." Can you provide a link? $\endgroup$
    – Sycorax
    Commented Apr 4, 2023 at 13:42
  • $\begingroup$ Yes sorry, I edited a link. $\endgroup$
    – sdeluxe
    Commented Apr 4, 2023 at 13:46
  • 4
    $\begingroup$ Welcome to CV. The link includes the crucial proviso "with the condition that all B-spline coefficients are nonnegative." Without suggesting a B-spline is a good solution (I think it's not in general), you can find how to create such splines by searching our site for monotonic spline. $\endgroup$
    – whuber
    Commented Apr 4, 2023 at 13:50
  • $\begingroup$ Thank you! I think i find a solution I think I found through your link to a scipy library. docs.scipy.org/doc/scipy/reference/generated/… $\endgroup$
    – sdeluxe
    Commented Apr 5, 2023 at 9:30

1 Answer 1

0
$\begingroup$

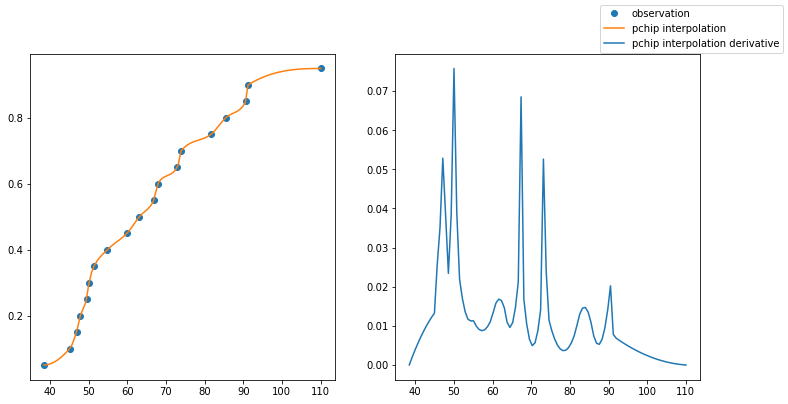
Thank you for pointing this out. I think I have been able to solve the problem for me.

from scipy.interpolate import pchip_interpolate

import numpy as np

x = np.array([ 38.45442808,  45.12051933,  46.85565437,  47.84576924,
        49.50084204,  50.09833301,  51.3717386 ,  54.85307741,
        59.91982266,  63.11786854,  66.90037244,  67.84446378,
        72.96120777,  73.92993279,  81.63075081,  85.42178836,
        90.70554533,  91.2393176 , 110.03872988])

y = np.array([0.05, 0.10, 0.15, 0.20, 0.25, 0.30, 0.35, 0.40, 0.45, 0.50, 0.55, 0.60, 0.65, 0.70, 0.75, 0.80, 0.85, 0.90, 0.95])

x_observed = x
y_observed = y
x = np.linspace(min(x_observed), max(x_observed), num=100)
y = pchip_interpolate(x_observed, y_observed, x)
y_d = pchip_interpolate(x_observed, y_observed, x, der=1)

fig, ax = plt.subplots(1,2, figsize=(12,6))
ax[0].plot(x_observed, y_observed, "o", label="observation")
ax[0].plot(x, y, label="pchip interpolation")
ax[1].plot(x, y_d, label="pchip interpolation derivative")
fig.legend()
plt.show()

enter image description here

$\endgroup$
4
  • 2
    $\begingroup$ Do you trust your own pdf? $\endgroup$
    – Nick Cox
    Commented Apr 5, 2023 at 10:46
  • 2
    $\begingroup$ Continuing the comment by @Nick, that's scarcely a plausible estimate of the pdf. It arises because you are not accounting for the estimation errors in the quantiles. Any reasonable procedure would do so and as a result would definitely not exhibit such extreme spikes -- it would surely result in a far smoother estimated density. $\endgroup$
    – whuber
    Commented Apr 5, 2023 at 16:22
  • $\begingroup$ @whuber: If I understood it correctly from the comments, then I would have to account for the estimation errors of the quantiles. Unfortunately, I cannot find a procedure for this. Can you help me with this? Are there any approaches that take this into account? Thank you very much. $\endgroup$
    – sdeluxe
    Commented Apr 13, 2023 at 8:18
  • 1
    $\begingroup$ See stats.stackexchange.com/a/34894/919 or stats.stackexchange.com/a/68238/919 for explanations and examples. $\endgroup$
    – whuber
    Commented Apr 13, 2023 at 13:25

Your Answer

By clicking “Post Your Answer”, you agree to our terms of service and acknowledge you have read our privacy policy.

Not the answer you're looking for? Browse other questions tagged or ask your own question.