0
$\begingroup$

My current assignment at work deals with our in-house task system, which is largely responsible for executing operations and other work asynchronously from the usual HTTP request/response workflow. I want to present aggregate data and statistics about these tasks in a clear, useful manner.

Some kinds of tasks are parent tasks, where they delegate a large amount of work to a number of children that are each responsible for a chunk of that work. Consequently, these parent tasks tend to run very quickly, in the realm of 1-20 milliseconds. However, since the child tasks are actually doing work, they can take several seconds. That said, when we humans look at these tasks, we care more about whether all of a parent's children are done. In that regard, the explicit duration of a parent task is not as useful as the sum of durations for the children. A further wrinkle is that we have multiple task workers, so a handful of tasks can be done in parallel.

Here's an example I just made up on the spot (where Avg and StdDev are the mean and standard deviation of task durations):

Task | Count | Avg    | StdDev
A      5       10 ms    3 ms
B      50      850 ms   40 ms

Here, each task of type A spawns 10 subtasks of type B. Additionally, let's assume that there are four workers so up to four tasks are executing concurrently, and subtasks execute in the same order that their parents do.

Hence, the mean total duration for a single task of type A, from when the parent is started to when all the children are finished, is probably roughly $10 + 850 * 10 / 4 = 2135$ milliseconds. However, I don't know if this is the best way to calculate the overall mean, and I have no idea what's best for overall standard deviation.

How can I decently estimate the overall mean and standard deviation of a set of tasks chosen from two different populations? The interpretation of "decent" is open but as a gut feeling, I would consider calculating an estimate within $\pm20\%$ of the true value as being "decent".

$\endgroup$

1 Answer 1

1
$\begingroup$

It seems to me you are mixing the times for series and parallel performances of 'child' tasks.

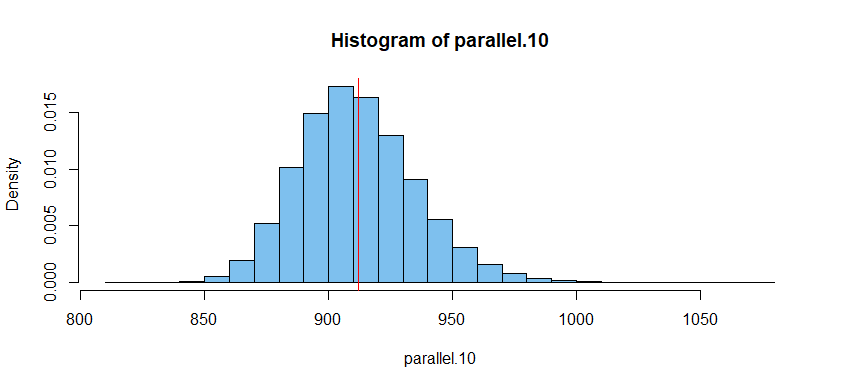
If we modify your example so that 10 workers are up and all 10 'child' tasks are done in parallel, then the time to completion is the sum of time for the 'parent' and the longest (maximum) 'child' working time.

Assuming normally distributed working times all around, then the average wait would be about $10 + 912 = 922,$ not $10 + 850 = 860.$

The distribution of the maximum of 10 independent normal working times is not trivial to compute analytically, but easy to simulate:

set.seed(817)
longest.of.10 = replicate(10^6, max(rnorm(10, 850, 40)))
mean(longest.of.10)
[1] 911.5538

enter image description here

However, without verification based on data, it is not clear that individual working times are normally distributed.

Also, it is not clear what combination of series and parallel work you have in mind for four workers doing 10 tasks. One scheme might be to treat it as a four-server queue with 10 'customers' waiting in the system. But the most common assumption with queues is that working times ('service times') are exponential.

If you could clarify which workers are performing in series and which in parallel when 4 workers are assigned 10 tasks and what distribution is reasonable for working times on individual tasks, that would be helpful information toward a complete Answer.

Addendum. You commented, "I think it's a decent assumption that workers 1 and 2 process three tasks each while the other two workers get two each. Thus, the total time for the 10 child tasks to complete is roughly the expected sum of three samples from task B's population. How can I estimate this (well enough)?" While other configurations are technically possible, I agree these seem the most likely possibilities.

The sum of 3 independent random variables distributed $\mathsf{Norm}(\mu=850,\sigma=40)$ has distribution $\mathsf{Norm}(\mu=3*850, \sigma = \sqrt{3*40^2}) \equiv \mathsf{Norm}(2550, 69.28).$ Then as above, we can find the maximum of two such random variables to be about $2589$ (slightly larger than 2550), by simulation:

longest.of.2 = replicate(10^6, max(rnorm(2,2550,69.28)))
mean(longest.of.2)  
[1] 2589.134
$\endgroup$
0

Your Answer

By clicking “Post Your Answer”, you agree to our terms of service and acknowledge you have read our privacy policy.

Not the answer you're looking for? Browse other questions tagged or ask your own question.