6
$\begingroup$

I'm experimenting with ROC-AUC for binary classification problems. I want to generate synthetic data for a given AUC score. The inputs of the problem are the following:

  • A vector of labels, made of 0's and 1's.
  • A given AUC, let's say 0.8

I want to generate a vector of scores (preferably between 0 and 1) that, with these labels, has the given AUC. I know the solution is not unique but I cannot think a way to generate such vector of scores. An implementation in R would be also great.

$\endgroup$
4
  • $\begingroup$ In the WORST case, remember that you can use “brute force” and ask R to simulate the scores and solve the reminder of the problem (the measurement of AUC) for each of the n simulations, and stop the simulation loop for k<n iff the measured AUC for the scores simulated at k is in a range very close to 0.8. It will be time-consuming but if you initialize and guide the solver in a reasonable way then the time to get there will be reduced, especially if for each iteration the volume of data is not excessively big. It’s like saying: R will make the hard work for me and will try until it gets there $\endgroup$
    – Fr1
    Commented Aug 20, 2019 at 11:02
  • 2
    $\begingroup$ Coding questions are off-topic here, I'm afraid. $\endgroup$
    – mkt
    Commented Aug 26, 2019 at 7:44
  • $\begingroup$ This might be a shortcut. I worked on a similar project and based my simulation on the reasonably good assumption that AUC will have a decent linear correlation (although the quadratic fit is better) with the R-squared between the two variables -- the continuous "score" and the binary "prediction." $\endgroup$
    – rolando2
    Commented Aug 26, 2019 at 18:33
  • $\begingroup$ I think you made a mistake and by predictions, you mean labels/targets and the scores are the predictions right? $\endgroup$
    – rep_ho
    Commented Aug 29, 2019 at 20:04

1 Answer 1

12
+50
$\begingroup$

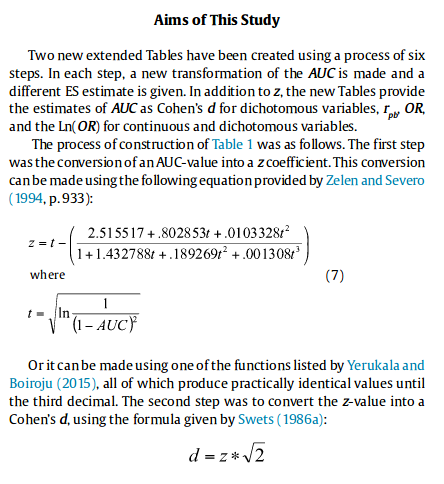
There are multiple ways to do it. One is to assume to transform AUC to cohen's D and then just sample data from 2 standard normal distributions D standard deviations apart.

We can transform AUC to D according to a formula from SALGADO, Jesús F.. Transforming the Area under the Normal Curve (AUC) into Cohen’s d, Pearson’s r pb , Odds-Ratio, and Natural Log Odds-Ratio: Two Conversion Tables. The European Journal of Psychology Applied to Legal Context [online]. 2018, vol.10, n.1, pp.35-47. ISSN 1989-4007. http://dx.doi.org/10.5093/ejpalc2018a5
enter image description here

Which in R code will work like this

auc <- 0.95

t <- sqrt(log(1/(1-auc)**2))
z <- t-((2.515517 + 0.802853*t + 0.0103328*t**2) / 
          (1 + 1.432788*t + 0.189269*t**2 + 0.001308*t**3))
d <- z*sqrt(2)

n <- 10000
x <- c(rnorm(n/2, mean = 0), rnorm(n/2, mean = d))
y <- c(rep(0, n/2), rep(1, n/2))

library(AUC)
auc(roc(x, as.factor(y)))

# out
# [1] 0.9486257

Of course, since we are sampling, this will produce the correct AUC on average, but the specific sample will not be exactly the required AUC.

$\endgroup$
1

Your Answer

By clicking “Post Your Answer”, you agree to our terms of service and acknowledge you have read our privacy policy.

Not the answer you're looking for? Browse other questions tagged or ask your own question.