18
$\begingroup$

For example, if my table is:

                True Value (gold standard)
                   Positive  | Negative |
         |        |          |          |
Test     | Pos    |    A     |     B    |   
Result   |        |          |          |
         | Neg    |    C     |     D    |
         |        |          |          |
$\endgroup$
4
  • 6
    $\begingroup$ It's not clear to me that there can be a useful answer to this question. The receiver operating characteristic (ROC) curve represents the range of tradeoffs between true-positive and false-positive classifications as one alters the threshold for making that choice from the model. A contingency table represents the classification results at a particular choice of that threshold. One might be able to calculate something like an area (as one proposed answer here does), but it's not clear that would truly represent the area under the ROC curve for the full model. $\endgroup$
    – EdM
    Commented Oct 17, 2018 at 17:31
  • 1
    $\begingroup$ If your predictor is dichotomous, and there is therefore only one threshold, I think the AUC still provides (some) useful information. $\endgroup$ Commented Oct 17, 2018 at 20:18
  • $\begingroup$ @JeremyMiles please provide non-trivial example of the predictor where only one threshold exists. $\endgroup$
    – ptyshevs
    Commented Jul 8, 2020 at 17:58
  • $\begingroup$ @PavelTyshevskyi - sure. (I forget what the context was for this question). I work with raters who classify ads. One example is pornography (which is bad). We ask raters "Is this ad for pornography?" They say yes, or no. $\endgroup$ Commented Jul 9, 2020 at 0:49

2 Answers 2

35
$\begingroup$

In the general case: you can't

The ROC curve shows how sensitivity and specificity varies at every possible threshold. A contingency table has been calculated at a single threshold and information about other thresholds has been lost. Therefore you can't calculate the ROC curve from this summarized data.

But my classifier is binary, so I have one single threshold

Binary classifiers aren't really binary. Even though they may expose only a final binary decision, all the classifiers I know rely on some quantitative estimate under the hood.

  • A binary decision tree? Try to build a regression tree.
  • A classifier SVM? Do a support vector regression.
  • Logistic regression? Get access to the raw probabilities.
  • Neural network? Use the numeric output of the last layer instead.

This will give you more freedom to choose the optimal threshold to get to the best possible classification for your needs.

But I really want to

You really shouldn't. ROC curves with few thresholds significantly underestimate the true area under the curve (1). A ROC curve with a single point is a worst-case scenario, and any comparison with a continuous classifier will be inaccurate and misleading.

Just give me the answer!

Ok, ok, you win. With a single point we can consider the AUC as the sum of two triangles T and U:
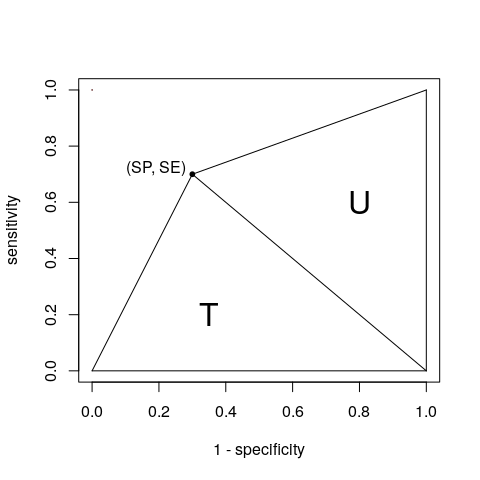
A ROC curve with a single (SP, SE) pair and two triangles

We can get their areas based on the contingency table (A, B, C and D as you defined):

$$ \begin{align*} T = \frac{1 \times SE}{2} &= \frac{SE}{2} = \frac{A}{2(A + C)} \\ U = \frac{SP \times 1}{2} &= \frac{SP}{2} = \frac{D}{2(B + D)} \end{align*} $$

Getting the AUC: $$ \begin{align*} AUC &= T + U \\ &= \frac{A}{2(A + C)} + \frac{D}{2(B + D)} \\ &= \frac{SE + SP}{2} \end{align*} $$

To conclude

You can technically calculate a ROC AUC for a binary classifier from the confusion matrix. But just in case I wasn't clear, let me repeat one last time: DON'T DO IT!

References

(1) DeLong ER, DeLong DM, Clarke-Pearson DL: Comparing the Areas under Two or More Correlated Receiver Operating Characteristic Curves: A Nonparametric Approach. Biometrics 1988,44:837-845. https://www.jstor.org/stable/2531595

$\endgroup$
7
  • $\begingroup$ This example with a single point can be really misleading. For example, having point at (1, 0) will yield AUC=1 according to your calculations. Area under point is always zero. If you really need to summarize the contingency table, use f1 score or informedness. $\endgroup$
    – ptyshevs
    Commented Jul 8, 2020 at 17:54
  • 1
    $\begingroup$ @PavelTyshevskyi The ROC curve is always a curve, never a single point. Remember it shows 1-specificity, which is probably what confuses you. $\endgroup$
    – Calimo
    Commented Jul 8, 2020 at 19:54
  • $\begingroup$ @PavelTyshevskyi I mean (1, 0) is actually 0 specificity 0 sensitivity, so the AUC will be 0 as expected. $\endgroup$
    – Calimo
    Commented Jul 8, 2020 at 19:55
  • 1
    $\begingroup$ @PavelTyshevskyi can you be a bit more specific maybe? The answer is correct, and I think I clearly point out why you shouldn't do it in the first place. But I assure you, it is absolutely correct. $\endgroup$
    – Calimo
    Commented Jul 9, 2020 at 5:42
  • 1
    $\begingroup$ What a charming post! thanks for the good time and the info $\endgroup$
    – fr_andres
    Commented Jun 6, 2021 at 18:39
2
$\begingroup$

When I claim all of them are negative, then sensitivity (y) = 0, 1 - specificity (x) = 0. If I claim the positive/negative according to test results, then y =A/(A+C), x=B/(B+D). When I say all of them are Positive, then y = 1 and x = 1.

Based on three points with coordinate (0,0) (A/(A+C), B/(B+D)) (1,1), (in (y,x) order), it is easy to calculate the area under the curve by using the formula for area of triangle.

Final result: Area = $\frac {AB+2AD+2CD}{(A+C)(B+D)}$ ? Need to be verified.

$\endgroup$

Your Answer

By clicking “Post Your Answer”, you agree to our terms of service and acknowledge you have read our privacy policy.

Not the answer you're looking for? Browse other questions tagged or ask your own question.