0
$\begingroup$

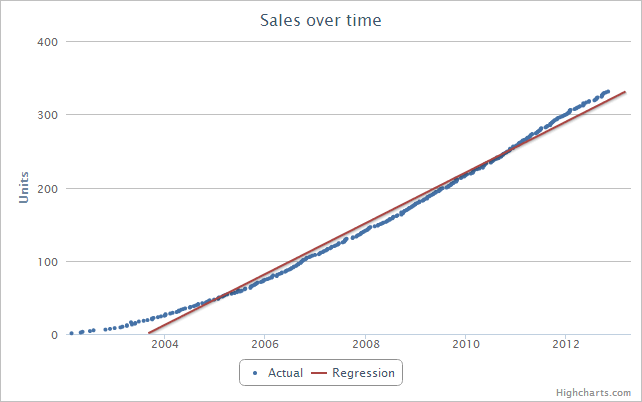
We sell machinery. The following is graph is an approximation of units sold over time for a particular piece of equipment1 :
https://i.sstatic.net/3m3rM.png

It starts out slow and slowly grows over time. I tried using linear regression, but if all data points are considered, the RMSE is in the order of 120 days, which is completely unacceptable.

If I only include the sales over the last 365 days (last 40 or so data points), the RMSE drops to a more acceptable 10 days.

Is there a better way to do this without arbitrarily discarding data? It seems like there's a small seasonal factor, where sales appear slower in some months. How can I incorporate that into the regression?

1 The data points are ${(Date, ID)}$, where $ID$ is a number assigned incrementally for each sale, and $Date$ is the actual date the sale was completed. Because some sales complete faster, lower ID's can end up with slightly later dates.

$\endgroup$
3
  • $\begingroup$ So that graph is almost a cumulative sales graph and in recent years you seem to be selling an item roughly every 9 days. What question are you trying to answer? $\endgroup$
    – Henry
    Commented Nov 9, 2012 at 23:28
  • $\begingroup$ @Henry I want to be able to predict when my next sales are going to be, accounting for growth rate and the seasonal factor, if it exists. $\endgroup$
    – Henry
    Commented Nov 9, 2012 at 23:30
  • 2
    $\begingroup$ You clearly don't want to use a straight line here. Something like a quadratic is very simple & would be the first step typically w/ data that look like yours. But that isn't really right either, because your data are cumulative, etc. The whole issue is misconceived. You may want to work with a statistical consultant. $\endgroup$ Commented Nov 9, 2012 at 23:43

3 Answers 3

1
$\begingroup$

It looks like you are trying to predict sales as a function of time.

I would ditch the cumulative approach and instead construct a scatterplot of sales vs time (days or months). Your x axis will be time (days, weeks, months, etc.), and your y-axis will be sales made within that unit of time.

I think what you will find is that your data IS actually suited to a linear regression model. Since the slope of your cumulative sales is increasing, that means that you are making more sales per unit of time (y/x) as time (x) increases. This will me much easier to see if you do what I've described above.

$\endgroup$
1
$\begingroup$

When you have time series data .e.g.monthly sales and you wish to model them in order to make a forecast and detect unusual activity one needs to know the following. Model selection is done by identifying the underlying model by examinining it's autocorrelative structure. In some cases the data might be independent over time then one could use a simple regression model with time as a predictor. In most cases there is auto-dependence and then one has to identify an appropriate model. Assuming any model is always very dangerous. Early approaches assumed different types of models for pedagogical reasons. The correct approach is to identify an appropriate ARIMA model that incorporates sufficient autoregressive memory and include any level shifts, local time trends, seasonal pulses necessary to adequately describe the data. Pursue the web for "automatic arima softare" to help you. Try the different available solutions on your data and measure forecast accuracy from a number of origins. Most software vendors have free trial versions.

$\endgroup$
0
$\begingroup$

Typically in such circumstances people use Exponential Smoothing prediction methods such as Holt-Winters prediction. The main advantage is that they are quite easy to calculate in Excel and they offer something akin to nonparametric regression upon which we can make prediction for next few periods of time. It is also important that it is possible to calculate standard error of prediction estimates, but for this you would be better of using specialized procedures, like HoltWinters found in R.

Don't be afraid to use R, as it can be easily merged with Excel and is free. See this post as an example.

While I totally agree with Nick Adams, that you can do some sort of regression on this data too, be warned that it is a time series, so you violate the fundamental assumption that the data points are independent from each other. So don't be tempted to calculate any sort of standard errors or significance based on regression models.

$\endgroup$

Your Answer

By clicking “Post Your Answer”, you agree to our terms of service and acknowledge you have read our privacy policy.

Not the answer you're looking for? Browse other questions tagged or ask your own question.